Pasting Chart into Writer from Calc Fails to Retain Numerical Formatting

Hello, all…

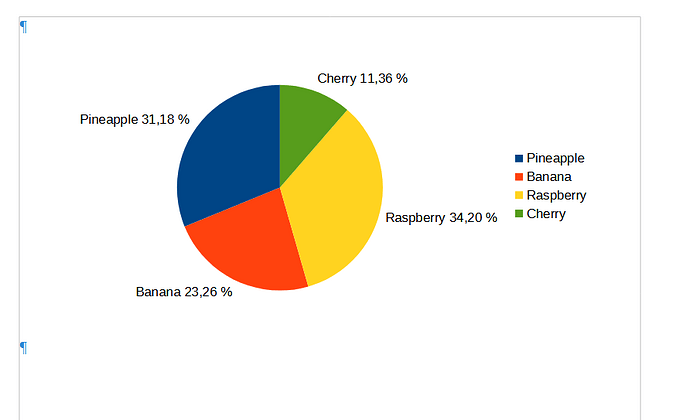
I’ve spent quite a bit of time creating several charts in my Calc spreadsheet and when I copy/paste them into Writer, the data labels lose all formatting; for example, one of my pie charts displays the percentages for each slice correctly in Calc, but when I paste it into Writer—regardless of which of the three selections I make—they are not displayed as percentages.

Help?

Thanks, in advance…

No problem for me.

Version: 24.2.1.2 (X86_64) / LibreOffice Community
Build ID: db4def46b0453cc22e2d0305797cf981b68ef5ac
CPU threads: 8; OS: Windows 10.0 Build 22631; UI render: Skia/Raster; VCL: win
Locale: de-DE (de_DE); UI: de-DE
Calc: threaded

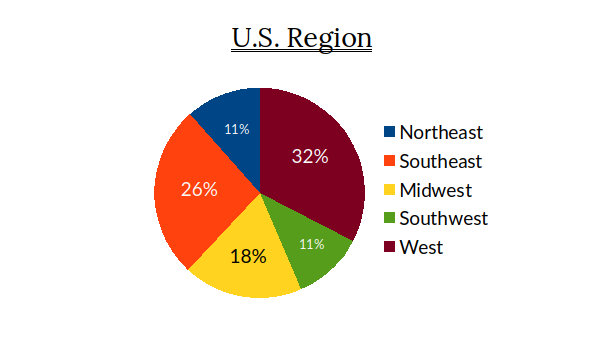
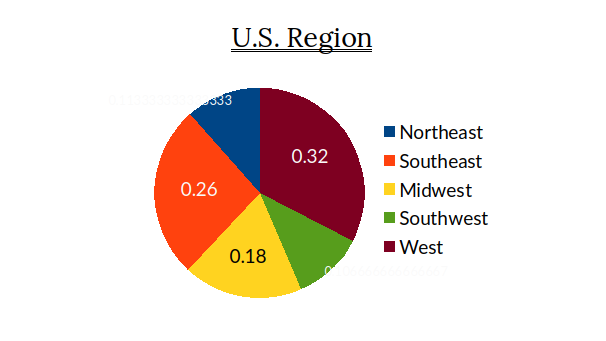
Well, now I’m confused because I’m also running that version of LibreOffice and getting different results; first is the graph as it exists in Calc, second is the copied version in a Writer document:

image

Version: 24.2.1.2 (X86_64) / LibreOffice Community
Build ID: db4def46b0453cc22e2d0305797cf981b68ef5ac
CPU threads: 8; OS: Linux 6.7; UI render: default; VCL: gtk3
Locale: en-US (en_US.UTF-8); UI: en-US
Calc: threaded

image

(Apologies for using two posts, but new users are limited to one media upload per post.)

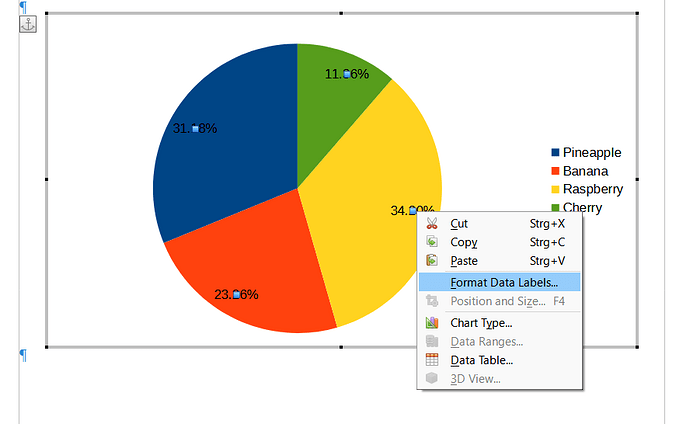
Reformat the data in Writer.

If there is no need for further editing in Writer you could paste the diagram in Special Paste as a GDI object. The diagram then can be losslessly scaled (e.g. no problems with embedded text parts).

Thanks for that suggestion; I accidentally stumbled on it, as well, and I don’t think it’s a great one simply because one shouldn’t have to jump through those proverbial hoops and it should “just work.” Special pasting as a GDI Object yields the same results as a “regular” paste for me… The only thing that works is exporting the chart as an image and then inserting the image, which has the obvious downside of not real-time changing the chart if data is altered in the spreadsheet. Perhaps I’m just expecting too much from LibreOffice…

Then you should not paste the chart but use an OLE link.

Interesting… I’ve never used OLE objects before. In quickly playing around, inserting one from the spreadsheet I already have seems to insert the entire spreadsheet and there doesn’t seem to be any method by which I can only select certain parts.

Create your chart in a separate sheet (one sheet for your data, one sheet for the chart) and link only this sheet.

1 Like