Percentage based histogram

Hello,
I am trying to make a histogram based on several percentages. I have a table like this:

Samp Percent
1    51.60
2    6.5
3    45.36
4    87.25
5    55.24
6    12.45
...
... etc.

I would like to see a distribution from 0 to 100 across the x axis while a count of how many fall into specific bins on the y axis.
Rough example:

       _
     /|||\                  _
    /|||||\               /|||\
   0 10 20 30 40 50 60 70 80 90 100 

I am not really sure how to get started.
I have managed to make a very messy column chart but the x axis is always the sample name and the y is always percentage.
Help?

I think you can not make a real histogram in Calc. But see the answers to this question.

Main problem I see is that you can’t define bins/buckets in a Calc-Chart.

Lets see if this helpsto do it: Add some columns to your setup.

   B     C    D   E   F
Percent Bin0 Bin1 X      Y-values
85.6    >0   >10  0 -10  =Countif($B$2:$B$100,Bin0)-Countif($B$2:$B$100,Bin1)
6.5     >10  >20  10-20  =Countif($B$2:$B$100,Bin0)-Countif($B$2:$B$100,Bin1)

The idea is to create your bin limits Bin0, Bin1 which double as part of the formula. Column X contains the bin-ranges. Y-values are the number of samples per bin. The first argument of the COUNTIF function has to contain all your samples.

Now you can make a Column-Chart with the x and y values. X-axis will show all bin-ranges -not exactly the %-range 0 to 100- and the length of the column is the number of samples/bin.

link is broken

The “array formula” FREQUENCY creates histogram data from unsorted raw values.

Actually using the FREQUENCY function is much easier than using lots of COUNTIFs and achieves the same thing.

@Confuddled @horst,

Why was horst’s proposal not the solution?

  • it is needed to define bins to count how many entries are in each bin
  • next is to create a column chart with bins at the x-axis and the counts on the y-axis

I did not check horst’s formulas because they look OK to me. I only used a different approach using not if-function and counted thereafter.

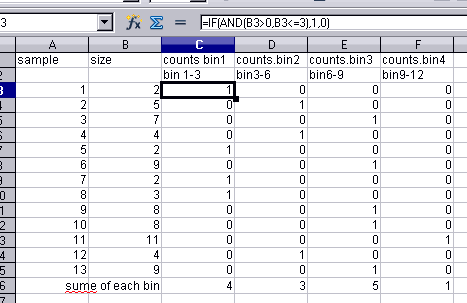
I defined 4 bins covering the range >0 and <=12.
For bin1 (>0 and <=3) I used the formula

=IF(AND(B3>0,B3<=3),1,0)

Here is what I did in Calc

image description

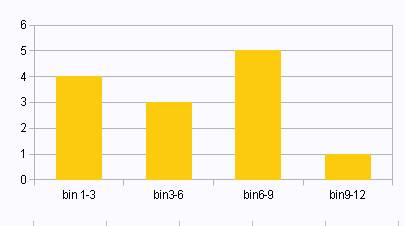
and what I got as chart (=histogram):

image description

After finding Min 9 (cell G13) and Max 57 (G14) of 37 data points in column C, I implement Sturges’ rule for determining bins, i. e. number of intervals G17 with =1+TRUNC(LOG(37,2)) and generate column of bins with =$G$13+TRUNC((ROW()-11)*($G$14-$G$13)/$G$17) filled with I11=8 (!NB MIN-1 and is skipped) 17 25 33 41 49 57

For data labeling I fill next column with =TEXTJOIN($H$1,1,I11+1,I12) where H1 is a cell with " – "separator to make the whole cell look like 9 – 17 … 50 – 57.

Finally F 12:17 cells I fill with array function =FREQUENCY($C$1:$C$37,$I$12:$I$17)