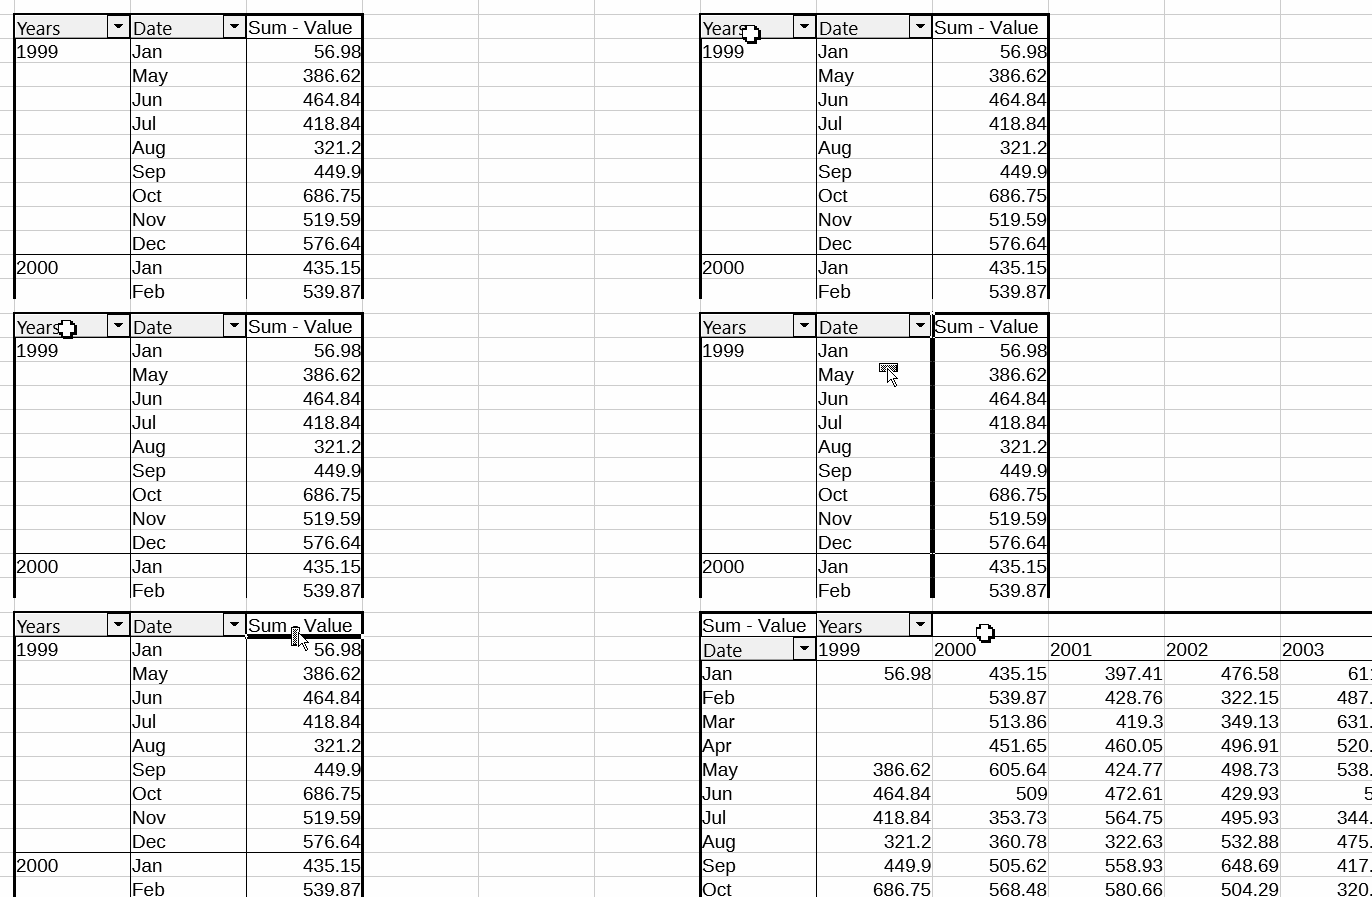
I am trying to set up a pivot table where I can view the distribution of entries by month over each of the previous years ie. months x years (rows x columns). Grouping by months and years within rows or within columns will not suffice
Welcome! As far as I understand, you can apply grouping using F12 on a date value? Now just click on the Year field header and drag it to the right

-
drag and drop the »dates« into Row-fields
-
from the pivot-output select any date and ⇒ Data ⇒ group and outline ⇒ group ⇒ [x]years [x]month
-
back in the Pivots-output drag&drop the year-label from the RowRange into the ColumnRange
Edit: to late again, as always @JohnSUN explains it with an excellent screencast!
Thanks very much, JohnSUN and karolus
Do you have a pivot table which you need to organize better, or do you have a data table which you need to create a pivot table from?
If your issue is not resolved by the help from @JohnSUN and @karolus, I suggest you edit your question posting to upload your file (or a copy with any confidential information mangled) so we see how your data is structured. The organizing/layout of elements, as well as data types, are of importance. Usually those things cannot be consistently determined from description or picture alone. A spreadsheet file is required for proper examination.
