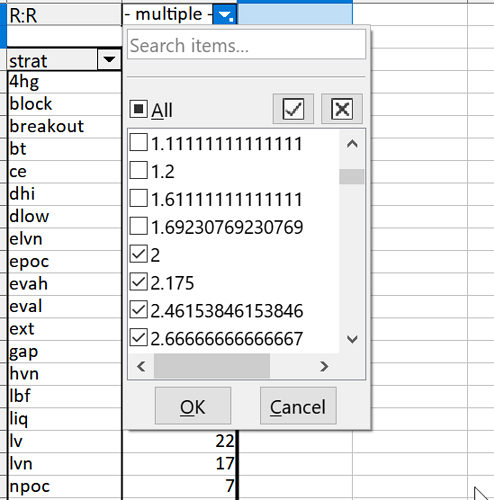
Now it’s getting a bit complicated. This is because you try to mimic a database on sheets, like 90% of today’s spreadsheet users.
- Call menu:Data>Define… and define the entire source list of your pivot table as a named database range. If that cell range makes up the entire data area on the sheet, you may skip this step and use the sheet name.
- Call menu:File>New>Database…
2.1 [X] Connect to existing database
2.2. Type: Spreadsheet
2.3. Specify your spreadsheet document.
2.4. [X] Yes, register the database document
2.5. Save the database document.
This is a fake database. Nothing has been converted nor copied. It treats certain spreadsheet areas as if they were tables of a database.
- Create a new query in design view.
3.1.Add the database range from step 1 as source table.
3.2. Add (double-click) the columns you need.
3.3. Below the “B:B” field add criterion > :Parameter
3.4. Hit F5 to test the query. It prompts you for a parameter and returns the selected rows based on that parameter.
3.5. Save the query under some name.
- Save the database document and forget the database, but don’t delete it.
- Back to the spreadsheet, create a pivot from a registered data source.
5.1. Specify the data source (by default the name of the database document) and the query.
Every time when you refresh the pivot table, you will be prompted for the parameter.
Insert new rows in order to add new data to the source range (the database range from step 1) and save the spreadsheet. You may need to restart the office suite before the pivot table gets the new data. this problem would not occur if you were saving data in a true database.


