Hello!
I tabeled:
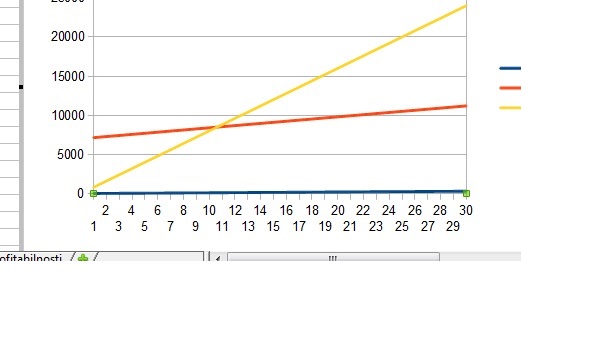
and I got it on graph like this:

So, why did I get numbers 1-30 instead of 10-300?
And, how to change it?
Many thanks!

Hello!
I tabeled:
and I got it on graph like this:

So, why did I get numbers 1-30 instead of 10-300?
And, how to change it?
Many thanks!
If I understand your layout correct you want a chart with labels in column I and the data for columns J to L.
Select all cells from column I to L. Click on the chart wizard, select Line chart in 1.page, click next. In 2.page check “First Column as Label”. Then you get values in column I as labels on x-axis, otherwise you will get all columns in chart and just a serial number as labels on the x-axis.