I have no problem making a bar graph when the columns are contiguous. A-Months, B-Income, C-Expenses, D-Assets. The month names are on the X-axis bottom, a currency scale is y-axis on left and i get 3 colour-coded bars for each month.
But when they are spread out on a much larger spreadsheet, problems.
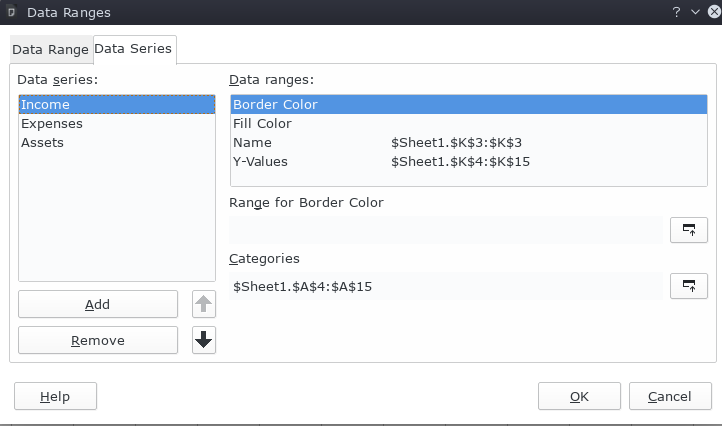
A4-A15 months
K4-K15 income
K34-K45 expenses
B55-B66 assets
When I Ctl-SELECT the 4 areas, the bar graph created is screwed up.
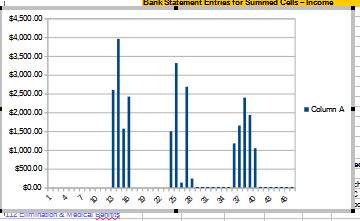
I get a garbled characters on x-axis. Just Column A in Legend and 3 set of columns with 4, 5, and 5 bars in them. Those are the number of months with data.The 1st set with 4 column is Assets. The next two are Income and Expenses. The Create Bargraph wizard is reading columns in wrong order. Not left to right at least. See screen snip.


 I had to delete the bargraph 3 times due to that
  How do i indicate your answer
 ) next to the answer