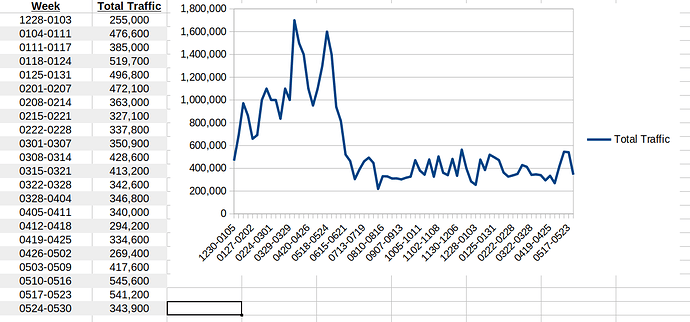
Since the start of 2020, I’ve been tracking weekly traffic to a website in Calc and using the data to create a chart. When I originally set it up, I entered the date range for the week (i.e., 0104-0111 for Jan. 4-11) in one of the columns and set it on the chart’s X-axis (see screenshot below). The problem I’ve run into is that, starting in January 2021, it got confusing because the year is not displayed. Is there an easy way to go back and add the year in, preferably by having Calc recognize that the cells include a range of dates?
TIA

