Recommended way to redraw graph?

Hello,

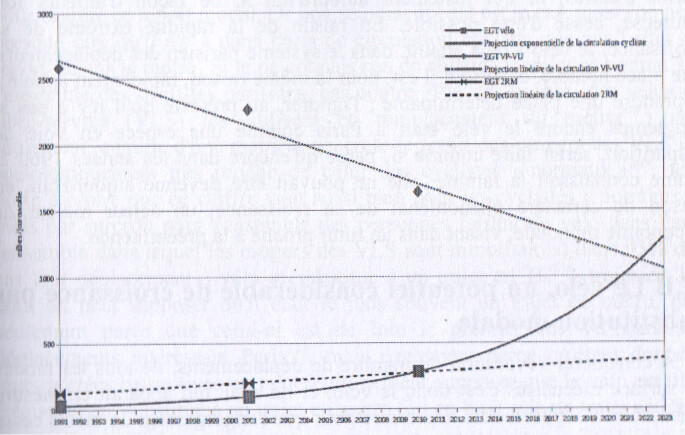
Here’s a scan from a book.

Since the orignal was itself a JPG instead of a vector graph, it looks crappy in the book, and even worse after scanning + saved into JPG.

Without much experience with things graphics, I’d like to redraw that graph with LibreOffice.

What tool would you recommend (Draw? Calc? Write?), and how to proceed as easily as possible?

Thank you.

image

Meiner Meinung nach ist es Calc.

Here is a small example of a line chart:

Line chart with points in Calc

English documentation

1 Like

Of course, Calc is the appropriate tool to generate Charts.

However, the given image is bad to a degree making it impossible, imo, to “redraw” it reasonably and to take -at least minimal- responsibility for the result and its supposed predication.

  1. The numbers along the axis need guessing. The title of the left axis is unreadable.
  2. The legend is unreadable, but refers to 6 data-series(?) or lines(?) while the diagram only has (at most) 4 of them.
  3. The diamonds seem to represent a series, but the nearby line only may be a related linear trendline.
  4. The other two lines don’t give any clue in what way they are defined or meant.

The only way to responsibly create a chart for the intended purpose is to thoroughly study (research) the original data and their context, and to produce a better chart then referring directly to numeric data and to the context, without a mention of the bad JPGed graph itself.

@Hrbgr posted links to start with, but the questioner should need quite some time for studies if not coming with previous experience.
2 Likes

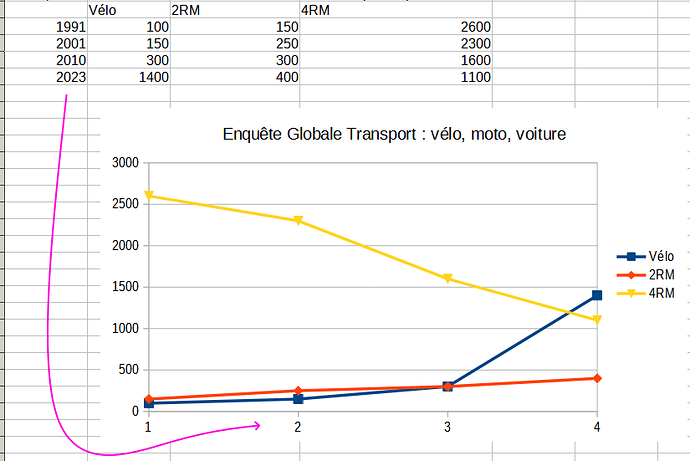
I’m close, but I need to display years at the bottom, instead of 1/2/3/4.

Any way to do this?

(Where’s your file? Images cause very annoying time expense if testing is needed.)

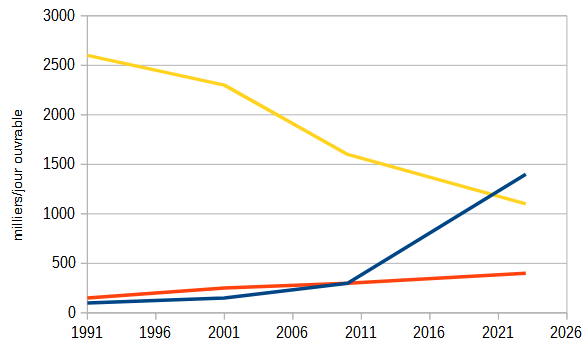
A Line chart can’t do this reasonably. The “labels” from column A would be presented equdistantly not regarding the actual differences in time (years). Use an “X-Y Scatter chart”.with the values from column A for the x-axis.

Here it is:


Edit: Looking much better with an X-Y Scatter chart. Thanks!
image

The editing window for posts here has a tool bar. The seventh icon (with the upward arrow) is linking to the tool for uploading files. No external service needed.
Was this tool not offered to you?

From LibreOffice 7.2 you can also label the data series.

https://wiki.documentfoundation.org/ReleaseNotes/7.2#Data_Series_Labels