
I am creating pivot charts in LibreOffice Calc, based on single column data (with Count values).
I have pretty much access to all elements in the pie charts I need to format as desired, however there is that annoying grey box bottom left (from where you can access some Legend settings). This box is unnecessary for my desired final display. I tried everything to remove it - but I cannot.
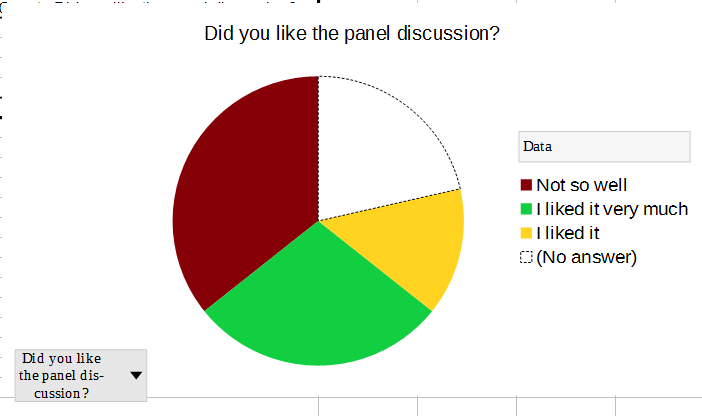
(The text in the box is actually the text from the headline cell in my one-column data source.)
How can I remove this from the chart, or at least make it invisible?