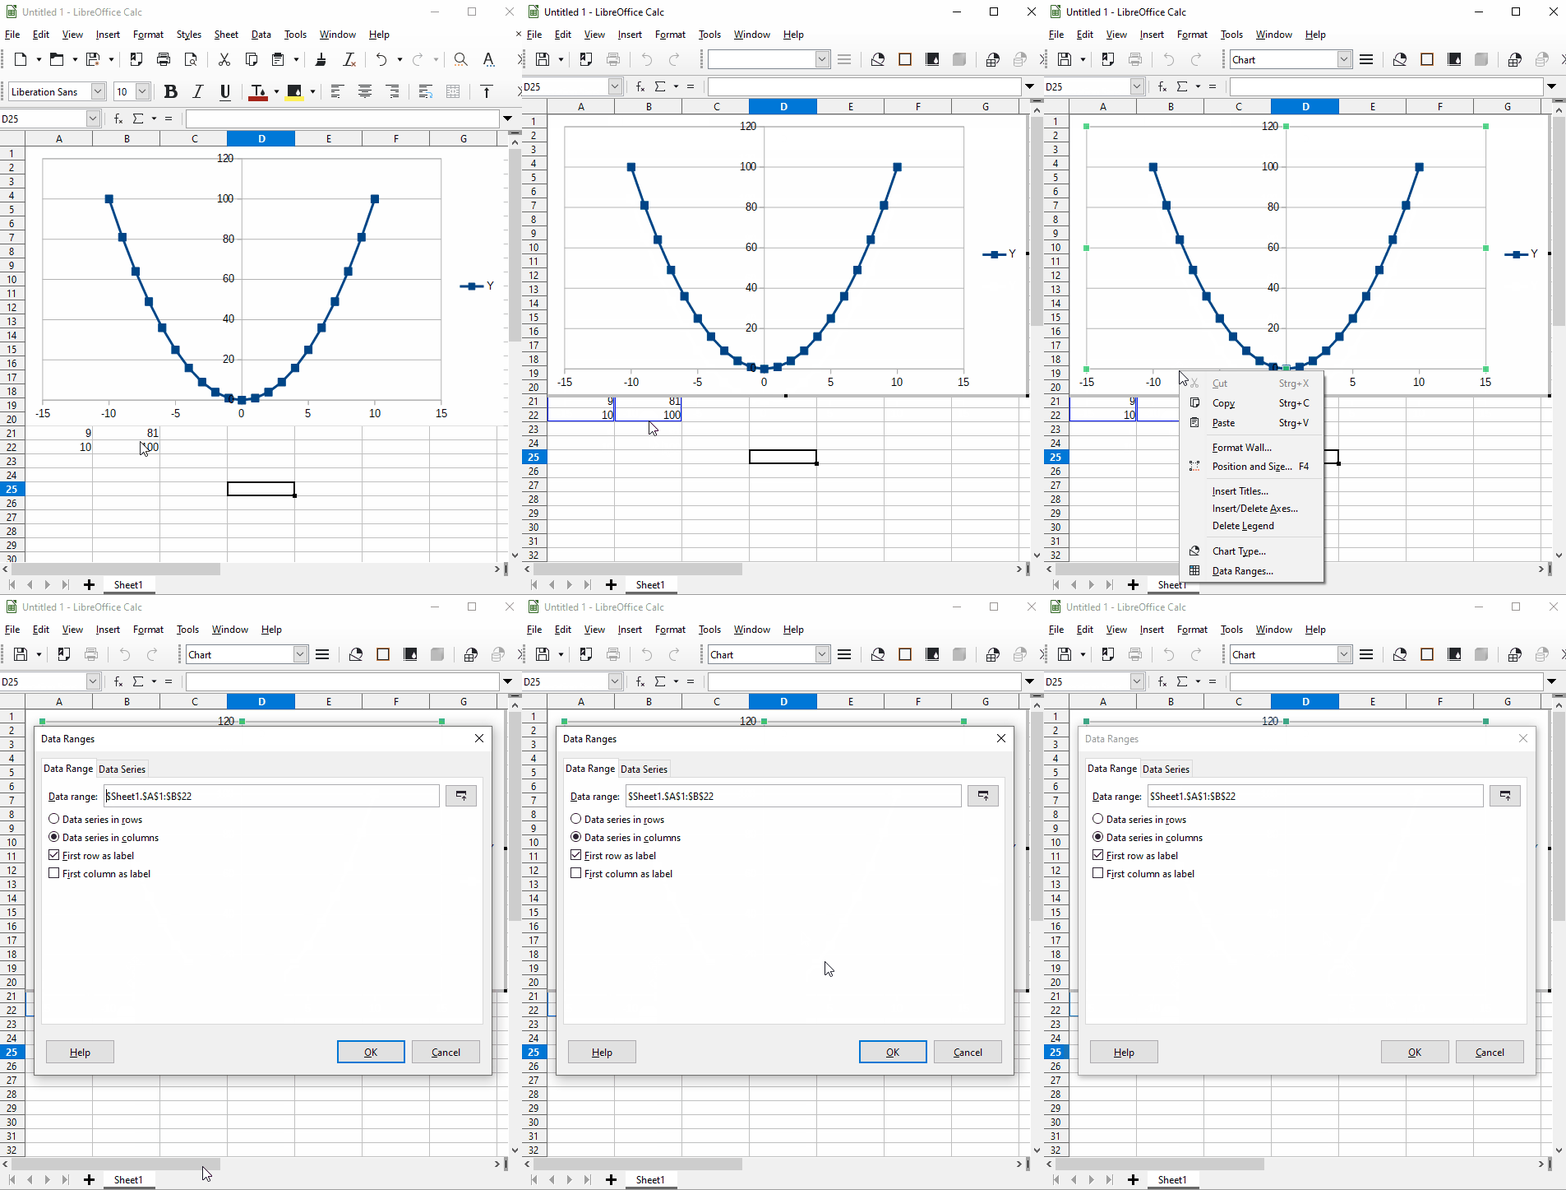
I am new to CALC, and have imported an excel graph and have updated the Data Range for the values, but I am struggling to find out how do I edit the X & Y axis Data Range.
Can some one help me please
Alan Price

I am new to CALC, and have imported an excel graph and have updated the Data Range for the values, but I am struggling to find out how do I edit the X & Y axis Data Range.
Can some one help me please
Alan Price
Hello,
to change the Data Ranges:
Right click -> Data Ranges