Scaling X axis for the time

Hello everyone,

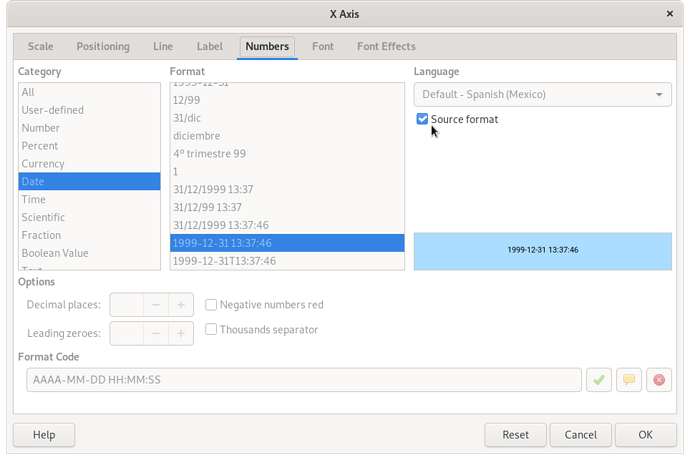
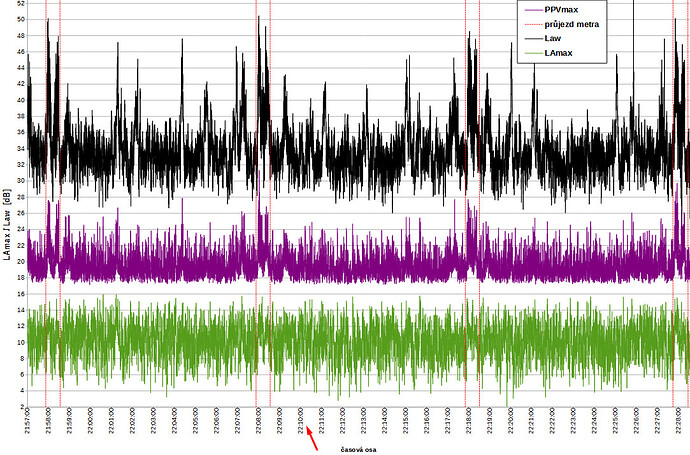
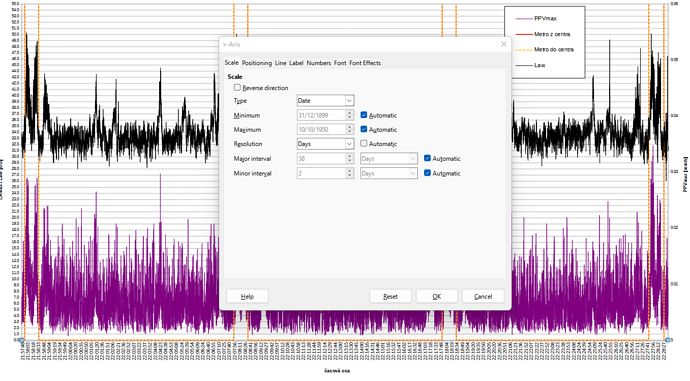
I have a chart with time going in x axis - the values are distributed haphazardly so I´d like to tidy up and scale it say for every minute, however after opening the x-axis tab - I can see only “date” features. It´s cool, but I need a time, not days or months or year. Any idea how to adjust x-axis for a time? Thanks

Please upload a small, .ods type sample file here.

How do you mean with

?

  • Sort by minutes, disregarding date?
  • Group data by minutes? I.e., the four data for 21:58 at the same X value?
  • Sort by date, hours and minutes, but only show the minutes?

I mean this - actually found the solution. It chart must be changed to XY scatter chart, where you can then select the TIME for the x axis. The usuall chart “line”, i normally use, doesn´t allow this. Hope it helps to others too.