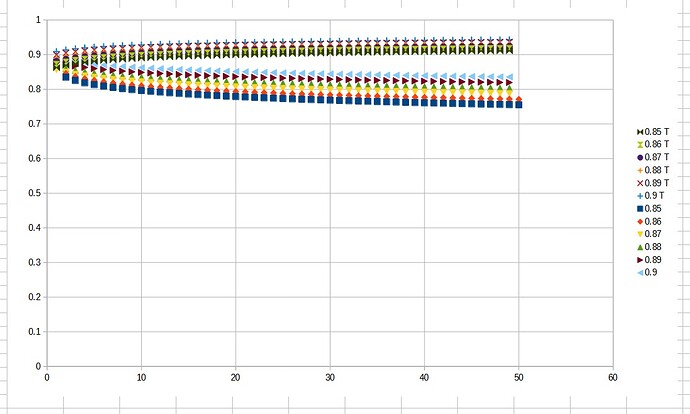
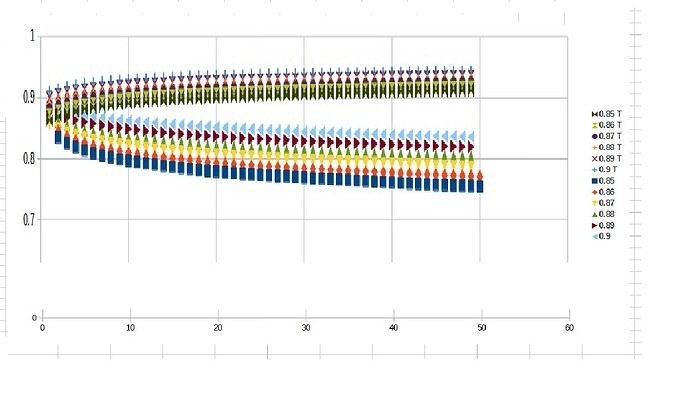
Like what EarnestAI said, you should be able to:
- Right click on the Y-Axis of your chart (when you hover over it should say “Y Axis”
- Select Format Axis
- Ensure the “Scale” tab is selected, then untick Automatic next to Minimum and Maximum.
This will allow you to specify the range of the Y Axis on your chart. For example, to provide a similar result as the image you provided, you could set the Minimum to 0.7 or 0.6, and the Maximum to 1. If this wasn’t what you meant, or need something clarified, feel free to ask!


