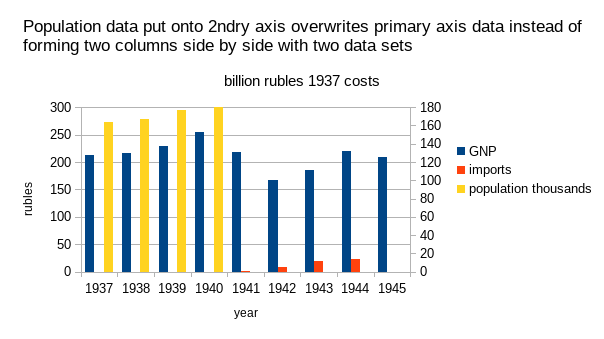
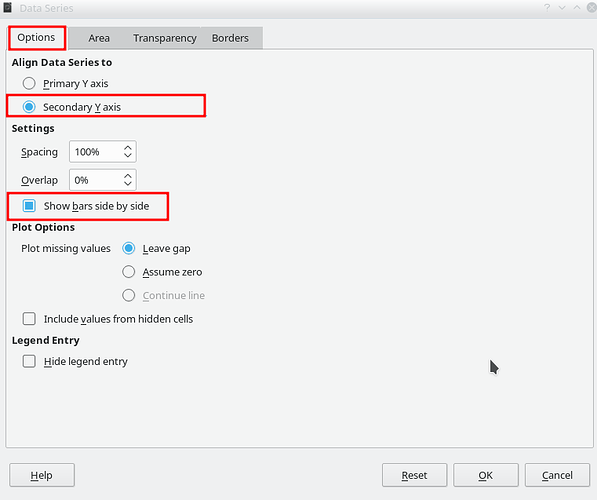
I am making a graph with columns side by side but the tick box on the data ranges sub-menu called “Show bars side by side” has disappeared. Where is it? Or how do I shows a graph with two sets of columns side by side without using it.
Can you upload a file with the type of graph you are making, and which displays the issue? Preferably the file where you are having issues, but if that is confidential, a file with dummy content should do nicely.
To upload a file, edit your question (no, don’t Add answer! Use the Edit link below your question) and click the paperclip tool icon above the edit pane.
If we have to guess at what specific settings are in effect for your graph, either because you have set them specifically for this graph or because of install defaults or your adjusted default settings, there is a good chance that our guesses will be wrong. Keep us efficient. Don’t make us guess.
File uploaded.In first graph it shows three data sets in stacked columns - this is ok
In the second graph I move one data set over to a secondary axis and instead of forming a second set of columns alongside the first set, instead it overwrites the first set.|attachment(/upfiles/1574853204822137.png)
You used to have a check box for this but it no longer appears on the data range properties
Untitled picture3.png
Seems you are using / used to OpenOffice (Icon on your image) and this is, with respect to LibreOffice, a bit an apple-to-oranges comparison.
What???
I am using Version: 6.2.7.1 (x64) LibreOffice
Build ID: 23edc44b61b830b7d749943e020e96f5a7df63bf
Calc
I cannot show you what I am talking about because it is not there and I cannot make it work, so I have just lifted some pictures from the internet to try and show you what I am talking about. It is not a real screenshot.
I used to be able to make 2 column graphs using this technique in LibreOffice but it no longer works.
I am not using OpenOffice.
Your picture Untitled picture3.png definitely shows an OpenOffice seagull logo at the left upper corner, and only after my comment you added any information about your LibreOffice version. So your astonished “What???” with three additional superfluous question marks is not appropriate.
I apologise if you are offended, it was un-intentional.
I was just trying to demonstrate my confusion with your comment about OpenOffice and it looked as if you were answering the question with regard to OO. Especially as the answer did notwork for me. No check box appeared.
It took a second comment to resolve the issue.
This is why I was confused as to whether we were talking OO or LO, hence my coment.
Thank you for solution it worked in the end and I appreciate all the hard work done by the volunteers on this site.
Hello,
perform the following
- Double click on one of your yellow data series data points (all values should be selected)
Right click -> Format data series -> Tab: Options- Set radio button Align data series to to
[o] Secondary Y Axis - Tick Settings option
[x] Show bars side by side
Finally you may want to disable the automatic scaling of the Secondary Y Axis and set your your own Maximum.
Result could look like this (changed Secondary Y Axis Max to 180):

Tested using LibreOffice
Version: 6.3.3.2, Build ID: a64200df03143b798afd1ec74a12ab50359878ed
CPU threads: 8; OS: Linux 4.12; UI render: default; VCL: kde5;
Locale: en-US (en_US.UTF-8); UI-Language: en-US, Calc: threaded
Hope that helps.
If the answer is correct or helped you to solve your problem, please click the check mark ( ) next to the answer.
When I look at this screen I do not see the check box “Show bars side by side”.
Instead I see a check box called “Connection Lines”.
I checked my graph and it is set to “stacked column” but it does not display the necessary check box for me to use the secondary axis.
What you have done is exactly how I would have done this action before my problem is that I do not see the necessary check box to perform the action.
Sorry
I checked my graph and it is set to “stacked column” but it does not display the necessary check box for me to use the secondary axis.
Right click your diagram to change chart type. Change the type from Stacked to Normal. (Click the sample chart icons in the top half.)
Brilliant! The check box has appeared and I can make the change, thank you very much to everyone who contributed.

