Show data point values on hover libreoffice linux

Hi!I am using LibreOffice version 7.0.4.2 on Debian 10 Buster.

I use LibreOffice Calc to compile my numerical data and create several charts based on this data.

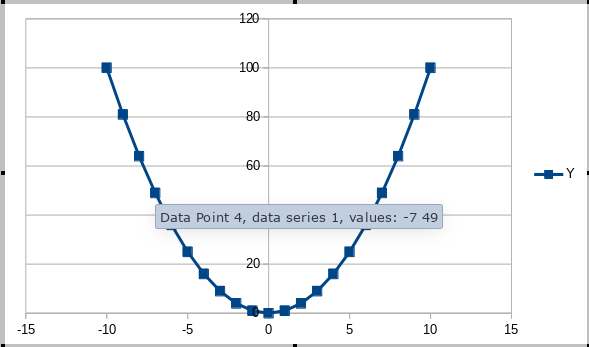
On Microsoft Excel,when one creates a chart,one can see data point values when you hover the mouse cursor over the chart like the image below

image description

How can I achieve the same in LibreOffice Calc?

First double click on the chart.

I had already tried that.It doesnt work

Secondary click and select Edit. Also can select the chart, choose menu Edit - Object - Edit.

Tested with LibreOffice 6.4.7.2/7.0.4.2 (x86); OS: Windows 6.1.

I had already tried that.It doesnt work

Generally it does - see:

image description


but just tested on Debian Buster using
Version: 7.0.4.2, Build ID: 00(Build:2), CPU threads: 4; OS: Linux 4.19; UI render: 
default; VCL: gtk3, Locale: en-US (de_DE.UTF-8); UI: en-US,Debian package version: 1:7.0.3-3_bpo10+1, Calc: threaded

and it doesn’t work on Buster. I’d suggest you turn to Debian maintainers of LibreOffice and/or operating system.

Yes I suspected that also in Debian it may not work

Another test on my Linux system (see screenshot above, which uses KDE) resulted in the following: This is a problem of GTK3 Visual Class Library (VCL). Could reproduce using SAL_USE_VCLPLUGIN=gtk3 libreoffice7.0 and found the same result as on Debian Buster. So it is not Debian to blame but GTK3. Now I got no knowledge at all, whether GTK3 would support such feature at all and the problem is in indeed with GTK3 support of LibreOffice or GTK3 doesn’t support such features at all and hence LibreOffice couldn’t be blamed for that.

Not just Debian. I’m using LibreOffice 7.2.4.1 on a new Macbook Pro (M1 Pro) and hovering over chart lines only shows the column name (e.g. Column B) or column title.

It works with:
Version: 7.1.8.1 / LibreOffice Community
CPU threads: 1; OS: Linux 4.12; UI render: default; VCL: x11

Double click on the chart, or secondary click and select Edit. Also can select the chart, choose menu Edit - Object - Edit.

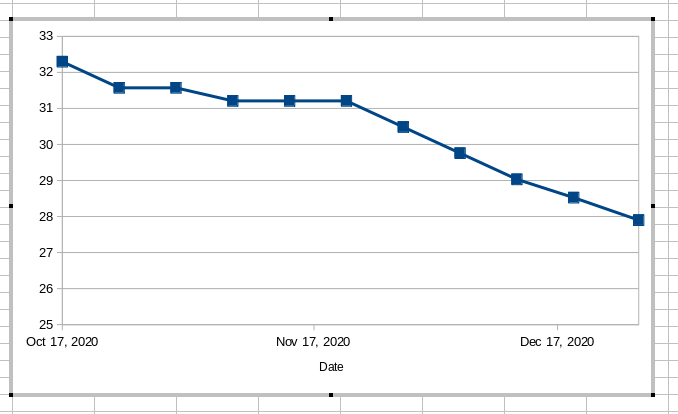
I double clicked on the chart as below and even tried selecting edit but still nothing when I hover mouse

image description


Please do **not** use *Add Answer* but **[edit](https://ask.libreoffice.org/t/show-data-point-values-on-hover-libreoffice-linux/60140)** your original question to enhance the details of your question (answers are reserved for solutions to a problem on this Q&A site). Thanks in advance …

I could not add the image above in add comment forcing me to add answer instead