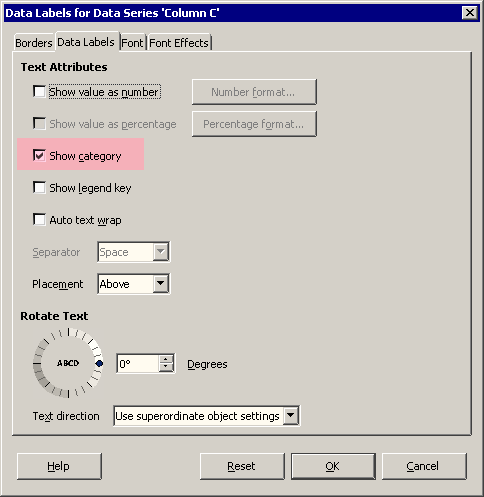
I want to show only the x-values at data labels in a chart. (red values in screenshot)
When I select “Show value as number” only the y-values are displayed.
Would somebody be so nice to help me?
Is there a solution at all?

I want to show only the x-values at data labels in a chart. (red values in screenshot)
When I select “Show value as number” only the y-values are displayed.
Would somebody be so nice to help me?
Is there a solution at all?
There are so many types of charts, and the image you attached doesn’t seem to be one of them. Why? Give useful examples, please. Tell what’s fact.
Probably waisting time with guessing:
Did you note the Babylonic usage of terms concerning the software.
What’s named Label e.g. in one place may occur as Category elsewhere.
Concerning charts the tendency is enforced by the many types where different terms for similar purposes in different contexts may seem appropriate.
For what I see, you are trying to add a line at Y = -0.75.
Insert Data Labels
Format Data Labels…, Data Labels tabShow value as number and mark Show category

When you are creating the chart, make shure to mark First column as label.
Tested with LibreOffice 7.0.6.2 (x86); OS: Windows 6.1.
More LibreOffice Help on Data Labels.
Thanks LeroyG and Lupp for your fast answers.
My created chart is based on a “Points and Lines” Chart with some Data series.
It is a little bit pity that only the y-values are displayed when you select “Show value as number”.
Leroy’s solution was very helpful, thank you.
Tested with Macbook Pro (2020), MacOS Big Sur 11.5.2, LibreOffice 7.1.5 64bit