Simple frequencies and means, by categorical variable, in calc

I have a data set. Two columns are AreaRegion (regions of the world) and population. I want to get means and sums of population by region (and number of rows in each region). Is there a simple way to do that, using drop down menus?

I tried removing columns in between these columns of interest, and then data / statistics / descriptive statistics, and selecting grouped by columns (and grouped by rows), and neither seem to work.

Any help?

Thanks

Gene

This looks like a pivot table question.

  1. Paste your data into a sheet
  2. Click on any cell within the data
  3. Using the menus, select Insert>Pivot table
  4. In the simple dialog that pops up accept using current selection
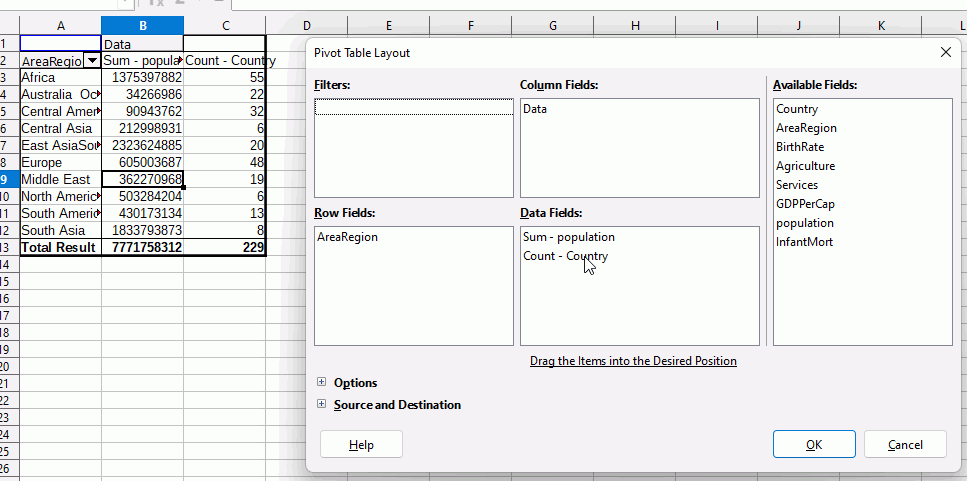
  5. In the multi-pane dialog that pops up drag Area Region to Row Fields
  6. Drag, say, population to Data Fields
  7. Sum - Population appears in Data Fields.
  8. Click Ok in the multi-pane dialog. There’s the totals data set in a new sheet.
    Now repeat the whole procedure, but when you see the Sum - Population appear…
  9. Double click Sum - Population.
  10. In the dialog the pops up click Average then Ok.
  11. Click Ok in the multi-pane dialog. There’s the mean data set in a new sheet.

To change an existing pivot table in one of the new sheets, just right click anywhere in the table and select Properties…

2 Likes

Thanks very much for this very quick response. This does what I want.

Is there any simpler way to do this, with a couple of clicks to get them all at once? In the data / statistics menu?

May I suggest:

1. →→Sheet→→import Sheet from File
1 Like

You can drag Population to the Data Fields pane several times, say, and then double click the different entries to select a different aggregation. Then you could have, e.g., Sum and Average on the same pivot table.

1 Like

That csv is a pivot table already. Each dimension has its own column. Each numeric value can be looked up by its column header and row header.

Thanks, this also helps. But I was really asking about the drop down menus, as I wrote in my original question…
Data / Statistics / Descriptive statistics

How do I get that to work on my data set? Or are folks saying it won’t work?

thanks

gene

You asked for sums of population by region (and number of rows by region), you wanted a simple way and using drop down menus.

Pivot table, as suggested by joshua4, is simple, in a drop-down menu and, most importantly, gives the results you asked for. You can get Count (or other function) instead of Sum if you double-click on an entry in Data Fields and select it.

I don’t think you can use Descriptive statistics with a non-contiguous range.

  • Sort your data by Area/Region
  • Click Data > Statistics > Descriptive statistics, select the block of data with the same Area/Region, select a destination, and click OK.
  • Give a heading to the new table to say what Area/Region it refers to.
  • Repeat for each Area/Region

The Calc Guide can be downloaded from English documentation | LibreOffice Documentation - LibreOffice User Guides . The Data Analysis chapter might help.

1 Like

Thanks all. I guess, for whatever reason, the drop down Statistics / Descriptive Statistics doesn’t seem to work for my data set, perhaps because of how my data set is constructed. So pivot table seems to be the only way.

Thanks