Greetings.
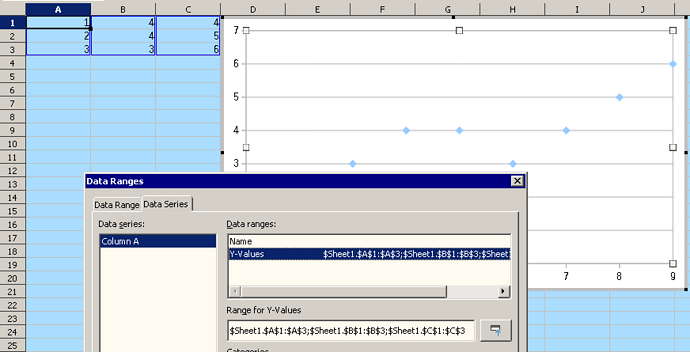
I have three columns with data which are really a continuity of each other. The first column has the data of population censuses from 1867 to 1914, the second from 1915 to 1961, and the third from 1962 to 2008. (You guessed it correctly, it is Canada.  )
)
What I want to do is a scatter plot that shows the Canadian population growth over that time span, but I can’t figure out how to have only a single series show up in my chart for those three columns.
Thank you in advance, and God bless.

