Snap Bar Chart to Rows

Hi All,

Sorry if this is covering ground that’s been trodden previously, but after searching for a while, I just couldn’t find the answer to my question.

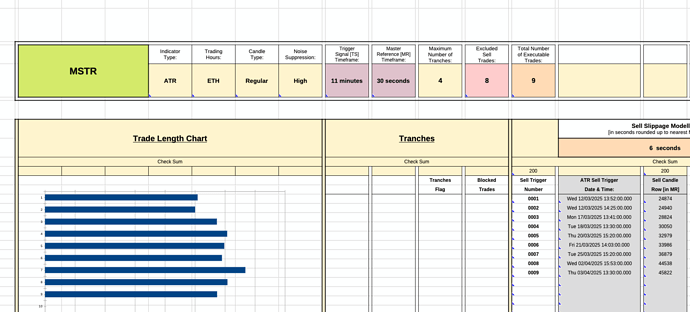
I have a speadsheet I’m building, and I would like to be able to pre-set a bar chart that aligns correctly on a per row basis. “Snap to Row” or some such

In other words , if you take a look at my screenshot, I’d like to find a way to automatically ensure each bar of the chart aligns within the row it is displaying data for?

Is this possible?

I’m happy to pre-populate the sheet with more rows than I hope I need, as I assume Dynamic Named Ranges won’t work well with charts?

Any help is much appreciated.

Regards.

CT

Have you tried Format - Conditional - Data bar?

Hey Earnest,

Thanks very much for the reply.

No I haven’t, because (being totally honest) I don’t really know what you mean? I’m quite a newb, so apologies if it’s not obvious what the “Data Bar” menu options does.

Without wasting too much of your time, are you able to elaborate?

Thanks again

CT

Data bar creates an in-cell single line bar, it could be based on the value, percentage, percentile, formula etc. of the cell compared to others in the range. In the sample below you could click Format > Conditional > Manage > Edit to see the current settings and the various options available. It might not be what you need but have a play.
SimpleDataBar.ods (15.3 KB)

Hi Earnest,

Thanks so much for the very useful info. I’ve just been deep diving into Data Bars, and I think they might be the perfect solution for me!!

Thanks for the demo sheet. Was super helpful.

The one issue I’m encountering now which is tangentially related, and has become an urgent priority if I want to use Data Bars as I was hoping to (and I thought I’d ask here in case you have a simple ready-made answer without me creating another thread) is:

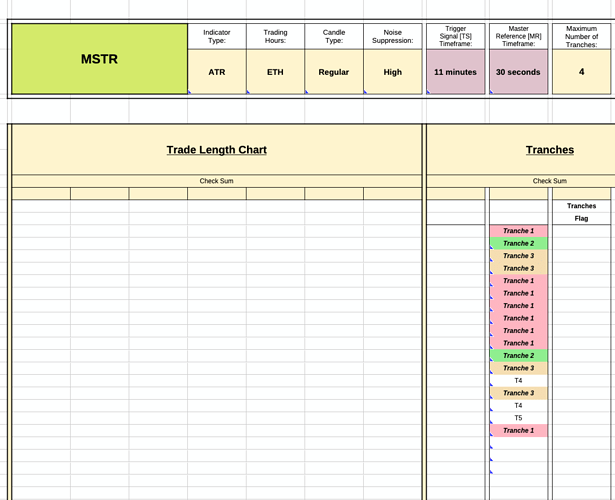
If you see from my screenshot, I would very much like to merge a sub-set of the cells under the heading “Trade Length Chart” to use for displaying the Data Bars. The reason is, I would like to maintain as many smaller individual cells in my dashboard header section above as possible.

The problem arises when this merge across several cells spans a large number of rows. The save time and file size grows enormously.

So my question is: Is there a way to “display” across several cells in a row, without having to “actually” really merge them??

Thanks again for your help. Much appreciated.

Regards.

CT

I would be reluctant to merge cells in a spreadsheet, it causes problems.

Maybe you could see if you could use a gantt chart method, Extensions » Libreoffice Extensions