Hello,
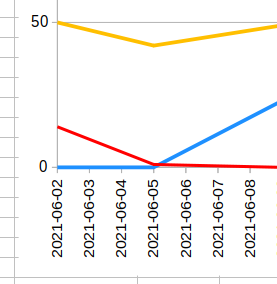
In a diagram in Calc, on the x-axis, I need to place values EXACTLY under interval marks. See the image.
Thank you for your help

Hello,
In a diagram in Calc, on the x-axis, I need to place values EXACTLY under interval marks. See the image.
Thank you for your help
I solved the problem : the diagram must be created in “(XY) Dispersion” type, not “Lines” type
Downloaded your sample and this is what I see:

Version: 7.1.4.2 / LibreOffice Community
Build ID: a529a4fab45b75fefc5b6226684193eb000654f6
CPU threads: 8; OS: Linux 5.4; UI render: default; VCL: gtk3
Locale: en-US (en_US.UTF-8); UI: en-US
Calc: threaded
Ubuntu 20.04.2 Mate