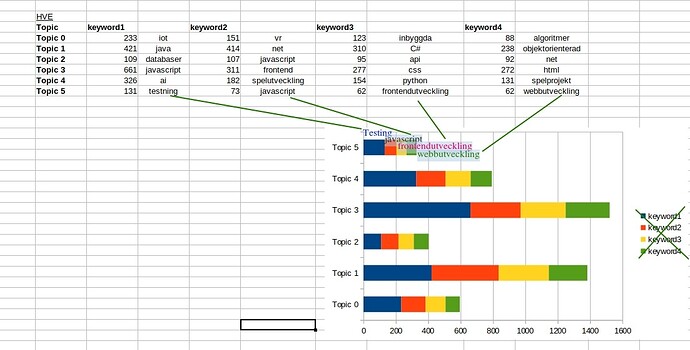
I am trying to create a stacked chart, but where each category has individual contents, in this case keywords. I want the keywords to printed directly in the graph… Please see attached screenshot.
Is this possible? Or do you have any suggestions for something similar but easier to create?
It might help to know if you are thinking of “analyzing” or “publishing” the end result. That is, are you looking for rapid updating to make decisions, or are you wanting a fixed result to be published for others to see.
Both. I want to be able to analyse and to discuss it…
However, I finally solved it by making a picture of the chart and manually put the texts on it in a bitmap editor… Similar to what I did in the screenshot.

