Stray Text Indelibly Embedded in Chart

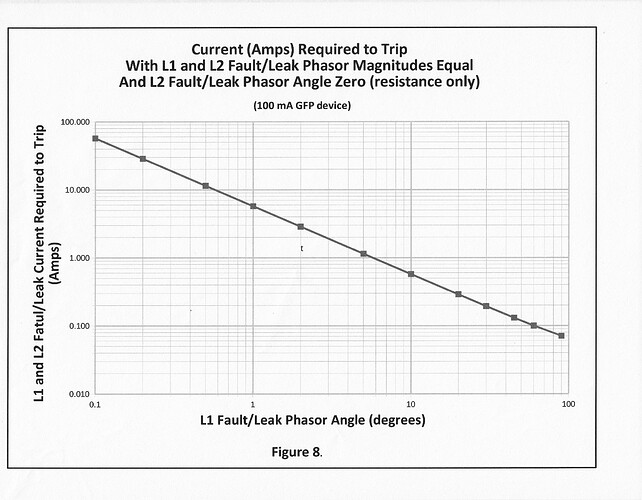
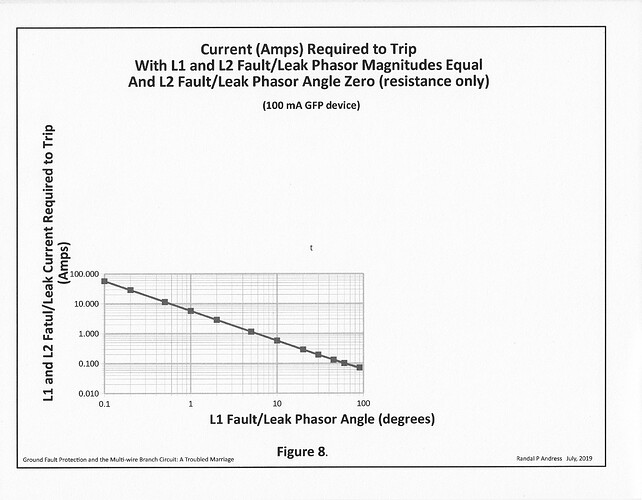
Several times while working with a chart (xy scatter) I have looked up to find some unwanted text on the chart. This time it is a lower case ‘t’. I have tried all I could think of to reveal, grab, and delete it, but nothing I tried has worked.

I have attached a jpg showing the ‘t’ at the center, in the chart.(letter-t-in-the-center.jpg)
I have also attached a jpg showing that if I shrink the actual plot, the ‘t’ remains in the center of the ‘canvas’. (letter-t-on-canvas.jpg)
Finally, I have attached a skeleton calc file: what’s left after deleting most of the content.(LibreOffice-Example-letter-t.ods)


LibreOffice-Example-letter-t.ods

Any suggestions?
-Randal

(Edit: activated screenshots -AK)

Neither on LO 6242 nor on OpenOffice 416 I could find the unwanted character. Even after altering some values in cells. Could you rename your office profile - probably a corrupt profile can cause such weird results…

Grantlier, thanks for the suggestion. However, renaming the …/4/user folder to force the creation of a new profile did not rid me of the ‘t’.
-Randal

Loading the document in any version I do see the t character at the position of about E79:E80 in the centre of the draw object. I found it to be the draw object’s text anchor. I don’t know why it is displayed here but not on a freshly created chart. However, seeing that you used LibreOffice 6.1.3 to store the file you can move it out of sight by right clicking on the chart object and from the context menu select Text… and then pick another Text Anchor position, but I can’t get rid of it. Later versions don’t offer the Text menu entry there anymore, and it also doesn’t make sense because the chart frame isn’t a text frame object, but maybe that’s the reason the anchor position is displayed at all for this object created using 6.1.3.

Update 2021-05-23 (as this appeared as changed in the notifications) -
It’s a text in the drawing object, see this answer.

erAck, Thanks identifying this ‘t’ as a responding to Text properties. I can now remove the ‘t’ by doing the following 1) Left-click on the chart area, 2) Left-click on the “Insert Text Box” button, 3) mouse over the ‘t’ and the cursor turns to a vertical bar (text editing bar), 4) Left-click to position the bar after the ‘t’, and finally 5) enter “backspace” to delete it!.
Thanks, again for your response,
-Randal

Oh it was actual text? I didn’t try that, lol :slight_smile: