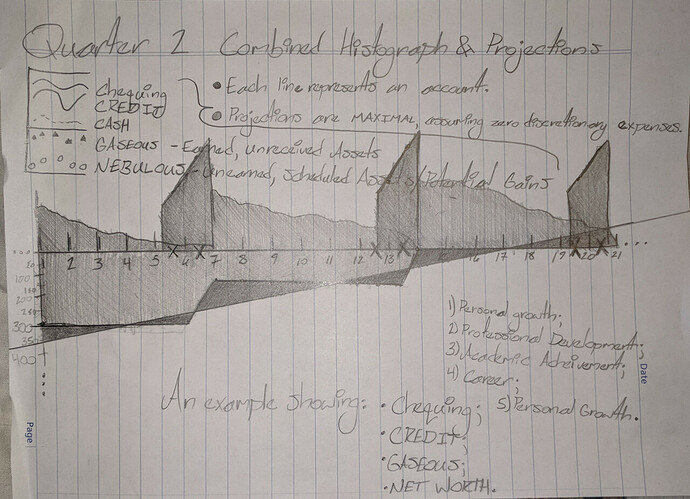
I have some financial data I’d like to process and graph. I have the transaction dates formatted as numbers, such that the first day in Quarter 2 is ‘1’ and the last day will be ‘91’. The values for the transactions are in adjacent columns, and there are multiple accounts with databases formatted as such on the same sheet.
I have for each account a running balance, such that there are multiple values for the balance of the account in a day if multiple transactions occurred. I have learned how to graph these running balances, but I am having difficulty creating a formula using functions to create the most important curve in my graph, which is Net Worth (Acc. 1 + Acc. 2 - Acc. 3… and so on).
How do I create a function to render the data for graphing Net Worth?
Here is an illustration of my planned graph, the entire purpose of the spreadsheets.
I could easily do it on paper, but that is wasteful and time-consuming to manually calculate and sum all of the values, and then plot them on paper of digitize the values and plot it with Calc thereafter.
In the end, when a TODAY function is called, I want it to check if a an earned, but unpaid/unreceived asset should have liquidated (pay-day) and to see if an unearned, scheduled, potential asset (a future workday) has passed (becoming a virtual or gaseous asset, rather than a nebulous one in my terms).
This will allow me to see the sum total of my finances at a glance, historically and in the near future for the purposes of large bill payments and savings deposits, as well as make projections for when I can expect larger lump sums if my budget is followed and discretionary expenses eliminated.
Any help is appreciated,
Thanks in advance!

