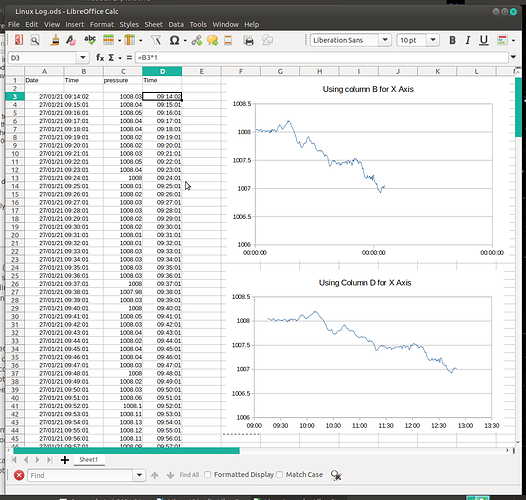
I have linked a text file to a Calc (Version 7.0.3.1, under Ubuntu) file. (I also tried this in Windows, with the same results.) The text file is being updated via a serial connection and the link is being updated. The data includes a timestamp, and a reading of atmospheric pressure. Everything works beautifully: I have a growing set of data in two columns that I want use in a chart.
BUT
When I chart it, the time data (eg 08:00:00, hh:mm:ss) from the linked file is seen as text, while the numerical data (e.g. 1008.1) is seen as numbers. So an XY chart takes the times as labels. If I edit the X axis, and say that it should not be formatted according to source format, but rather as time (hh:mm:ss), the data points are in a sequence, plotted against an X axis that has three markers, 00:00:00, 00:00:00 and 00:00:00. It is not seeing the data as time.
BUT
If I use a formula in another column like ‘=B3+24’ or ‘=B3*1’, and use that column as the x axis data, it works, it is seen as time data. However, the formula ‘=B3’ doesn’t work, it is treated as text.
In other words Calc sometimes sees the time data as a time (and can successfully manipulate it), and sometimes sees the time data as text, and cannot manipulate or use it.
Puzzling.

