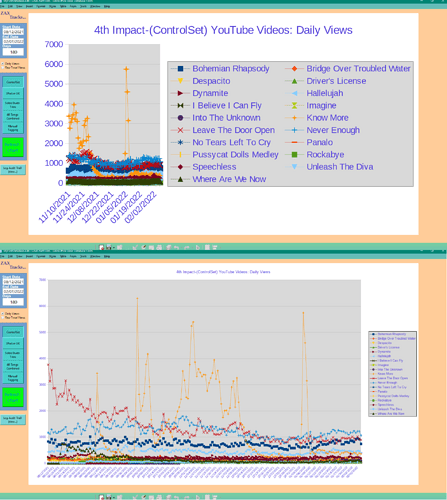
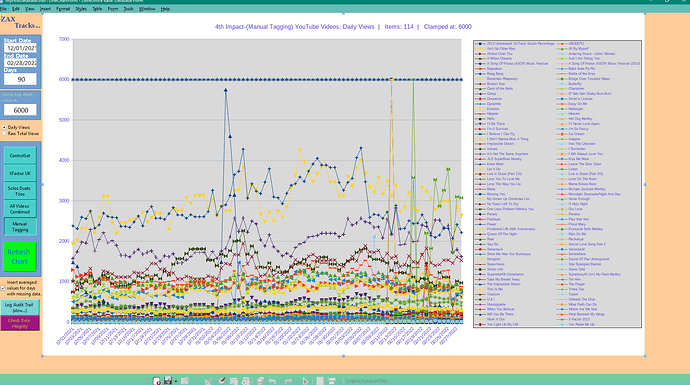
Using LO base to make a form with an imbedded Line-Chart. It works most of the time… but sporadically, for no obvious reason, it opens with it’s sizing all out of whack. Sometimes the chart is small and legend is HUGE…or the line thicknesses are super fat or the fonts are overly large, etc… As you see, the form allows you to setup inclusion criteria for the data…then a button to “Refresh Chart.” When it comes up wonky, i just keep hitting the rebuild button and eventually it comes out right. Anybody else seeing this kind of problem? I have tried a bunch of different things involving timing (wait…123) and even thought maybe there is some memory corruption going on… but can’t find it. This example has 3420 points plotted in the chart, but more or fewer points plotted has no effect on whether it comes out wonky or not. Any thoughts, ideas, or known solutions would be welcome. The screenshot on top is WONKY…the one below is correct. Oh…using LO:7.1.8.1 (x64) on Windows10 pc.
Seems there is something running like default font size. This will setting size of legend.
Right…the chart object seems to have defaults for everything so you only need to provide the x and y axis info and then the plot data with names that will generate the legend. You can turn options on and/or off and change sizing of each element programmatically, but i mostly leave it at defaults. i do make the line width narrower so more can fit in the chart. But, why those defaults auto-generate differently from one refresh to the next is really the big question.
Have more input now. I considered that perhaps pausing here and there throughout the process of instantiating and defining various parameters of the chart object would assure that each step was good before moving along to the next. So i spread a bunch of Wait 5 lines throughout that macro routine. What do you think happened? Yep! Totally discombobulated the scaling every single time. It never displayed correctly at all ever! Well, that got me to thinking timing was indeed part of the problem but it was the inverse of what i suspected. So I took ALL of the waits out and streamlined the code as much as possible. Now it works much better. Actually, it does not come out wrong so far…it is correct every time…but still too early to call it fixed. Anyway…hope this provides something that can help somebody else.
Hello,
Thank you for the information but do not know how the chart was created - totally from code or a pre-existing chart which is the modified?
Yes…made totally from code…actually, i think i used code that i found from one of your threads…
Have had slightly similar issues. Have broken the one large routine into smaller ones and actually call it with parameters now. Put chart into frames and recently modified a form with one chart to have two charts - only took a couple of minutes. No issues since all of this was done. Also now keep Chart SQL in a Base file and one of the parameters retrieves the necessary SQL for data extraction.
i’m currently playing with the arrays…thought maybe they are mistreating memory cause i initially dim them small and then redim them the size i need (much larger) once i figure out how many rows and cols i need. So now i dim them to (365, 200)… but it made matters worse…so that is not the answer. Interesting that my data never gets blasted…it is always still correct…only the sizings on the chart gets messed up…any kind of ‘refresh’ method on chart objects ???
Yes, i broke the long routine in smaller ones…but have to pass the arrays down through the chain so it goes a lot slower. Making the arrays GLOBAL makes it faster but that just felt wrong, and it did not fix the sizing problems completely… it still happens sometimes. yes, the sql is in the base code too… i do nearly everything in the base code (well, not the form design… i use the GUI for that). thanks for all of your input! 
As of now…the chart works 14 out of 15 times. For my purposes, that seems ok since i’m the only one using it and it is mostly just for gee-whiz. One thing i note is that if the actual creation of the embedded chart object is held off till last possible moment it works correctly more often. So, make all data pulls analysis, manipulation on tables with sql, base, whatever but don’t create the embedded chart object until all of that is done and ready and loaded up in arrays. Then make the chart object, fill it directly with the arrays and get the $%^&* out quick! That yields the best chance of getting a non-wonky chart. Just thinking out loud…in calc the chart is created and just sitting there and you can change and change and change the data with no problems. So, there might be some pearls of wisdom in there somewhere. Guess i’ll try making the chart first and then filling it slowly as i go…obviously the inner workings of the chart will continually keep changing their auto-sizing as the data get larger and larger. Probably will not fix the problem but may give more clues/ideas to chew on. Ciao!
@ZAX
.
Spent some time today testing my chart forms in Base. One of my originals that has occasionally given me a burp has been fine for some time. It does have a portion of code in python.
.
Others, in different Base files, have one to four charts on a form. Have a form with a single chart and a list box to create a number of different charts.
.
All worked without issue. Did execute many multiple times. Dozens of executions today and not one issue. Even took the original mentioned chart above and placed the data creation at the very end of the process and no problem.
.
Took a line chart and added more items to compare to your example - yours has 19 and I had 21 on mine and again no problem.
.
This is all on Linux and with LO v 7.3.0.3
.
Also, most of this is using PostgreSQL for the database. Note this as I do not have this established on Win 10 nor intend to do so. May try something different there.
.
Edit:
Do you have Skia enabled? Menu Tools>Options then under LibreOffice>View. If so, turn off & try that.
Thanks for checking further into this. i have actually run a chart with over 100 lines on it and find that has no discernable effect on whether the sizing goes haywire. My chart form also has a setting for ‘All Combined’ which always has only 1 chart line…and its chances of coming up wonky are just as high as the charts with more lines. So that does not seem to have any effect. Just went in and tried it with SKIA enabled. That caused some of my forms to NOT display various components here and there. It caused the chart’s data lines to be extremely fine to the point that they were almost invisible. So i guess it gives the rendering a finer resolution. Very cool to know. But the 3rd chart i tried came up wonky. So, guess that doesn’t help. i still wonder if my app is chewing up memory somewhere and the chart problem is a side effect of that. Or maybe all of these global variables i am using. Guess i’ll tear the app down and recreate without all of the global variables…was just ignorant of how openoffice worked and found something that worked at the time. i’m still 99% ignorant of how it works. It says that Libre is all open source… does that mean that i can actually look at the code that creates all of these Sun objects so i know exactly what everything does?
i worked with it some more. now the end of my chart macro looks like this:
'Insert created data arrays into chart area
oDocChart.Data.Data = aData2
'it is counterintuitive how row and column have been labeled here because setRowDescriptions actually sets the column descriptions
oDocChart.Data.setRowDescriptions(sXaxisDescriptor2)
'and setColumnDescriptions acutally sets the row/legend descriptions
oDocChart.Data.setColumnDescriptions(sLegendEntry)
oDataSeries = oXChartType.getDataSeries()
'just can’t live with the fat/mickey mouse line widths
for i = 0 to cntvideos-1 ’ adjust the plot line widths
oXDataSeries = oDataSeries(i)
oXDataSeries.LineWidth = 4
next i
'done, now get out quick before the chart gets weird…
End Sub
…and that gives me 50 out of 50 correctly created charts…so maybe this is solved. Seems there is still a bug in the system…but now it has stopped affecting my routine.
i moved some more stuff around and it works 50 out of 50 times…so maybe this work around is good enough. Interesting about the chart legend… it has 12 colors and 30 symbols so you would think you could have 360 different items in the chart…but no…libre starts reusing the symbols/colors at 60…so although it has no trouble putting over 100 items into the chart…some of them will have the same color and symbol once you go over 60…a bit confusing… 


