Updating a chart range in a macro - how to set range name and categories

Hi
I have a line chart in a spreadsheet that has two ranges and I am writing a macro to update the data ranges when more data is added.

I can update the data range, but can’t see how to set the name of each range and how to set the categories (that is, the values on the x axes). I can’t find any useful documentation for this anywhere.

This is a snippet my code so far

  oChart = oOutSheet.getCharts().getByIndex(0)

  oData = Array (oOutSheet.getCellRangeByName( "D2:D69").getRangeAddress(),_
         	              oOutSheet.getCellRangeByName( "E2:E69").getRangeAddress( ), 

  oChart.setRanges(oData)

the categories for the x axis are in cells A2:A69
When I run this code it labels the two dataseries as “Column D” and “column E” and the x-axis labels are just 1 to 68.

I’ve tried adding the range with the categories to the array but that just adds it as another data line.

I’ve run out of ideas. Can anyone help?

Thanks

Samo

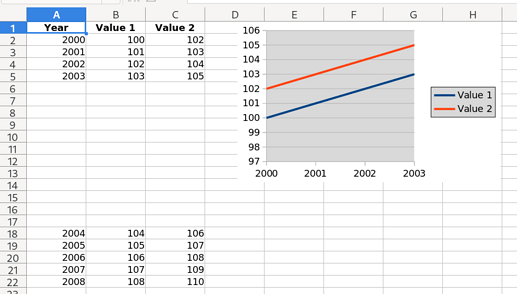
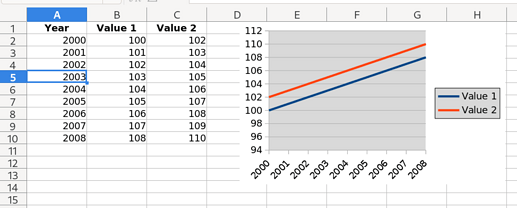
If you create your chart correctly, manually or by macro, then, you only need update your last row in your data range. The label for each serie is the first cell in column data.

Sub example_create_chart()
Dim rangos(0)
Dim pos_size As New com.sun.star.awt.Rectangle

	sheet = ThisComponent.CurrentController.ActiveSheet
	data_range = sheet.getCellRangeByName("A1:C5")
	charts = sheet.Charts
	
	With pos_size
    	.X = 8000
        .Y = 0            
        .Width = 10000
        .Height = 6000 
    End With
    rangos(0) = data_range.RangeAddress
    
	charts.addNewByName("MyChart", pos_size, rangos, True, True)
    chart = charts(0).EmbeddedObject
    chart.setDiagram(chart.createInstance("com.sun.star.chart.LineDiagram"))
	chart.HasLegend = True
	
End Sub

Sub example_update_data_range_chart()
Dim ranges(0)

	sheet = ThisComponent.CurrentController.ActiveSheet
	cell = sheet.getCellRangeByName("A1")
	chart = sheet.Charts(0)
	
	range = chart.Ranges(0)
	range.EndRow = get_last_row(cell)
	
	ranges(0) = range
	
	chart.setRanges(ranges)
	
End Sub


Function get_last_row(cell)
	sheet = cell.SpreadSheet
	cursor = sheet.createCursorByRange(cell)
	cursor.collapseToCurrentRegion()
	get_last_row = cursor.RangeAddress.EndRow
End Function

Of course, if you insert data instead of append, you not need macro for update your chart.

1 Like

Thanks, that was really useful.

It nearly worked…

It did update the ranges as expected, but it lost all the values in the “categories” - that is, the entries along the x-axis (in my case, month-and-year strings), which it replaced with just numbers from one up to the last range count.

hmmm

A sample file showing the problem will help to help you.

Ok, will do however I’m away for a few days so will do it when I get back.