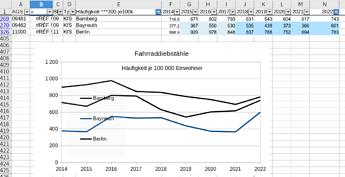
Use/reset fixed data range definitions with auto-filters

Hi all,

can I define a fixed data range, combining

  • a spreadsheet with several hundred records
  • auto-filter to select some entries
  • show those within a chart

…and do that again!?

The combination of the calc chart and auto filters works very well.

But when I do change the filtered choices, this does not work, but the chart remains empty, since a data range such as
$mysheet.$E$1:$N$500

will be changed by the autofilter to e.g.

$mysheet.$E$1:$N$1;$mysheet.$E$180:$N$180;$mysheet.$E$185:$N$185

which is very fine to show just the filtered records.

But when I want to add another line (=row) , when I want to chante the filters e.g. to line 190 and 195, the auto filter still works fine, but the chart remains empty, since line 180 and 185 can not show the values from lines 190 and 195.

I have to re-edit the data range definition to $mysheet.$E$1:$N$500, so then the proper lines will be shown.

The moment I enter the range to $E$1:$N$500 and leave the chart, the proper lines are selected - but immediately redefining the data ranges to
$mysheet.$E$1:$N$1;$mysheet.$E$190:$N$190;$mysheet.$E$195:$N$195

So I can tell the chart/sheet/filter to show what I want. But the way how do that just feels wrong, how the combination of chart’s data ranges and the application of auto-filters works together.

almost see the problem :neutral_face: but maybe an attached sample would help to go into details for a way towards a solution.
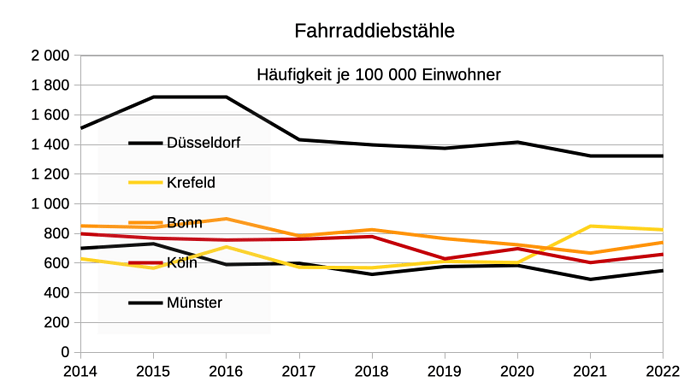
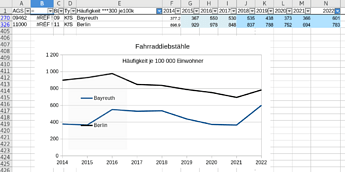
The data is from open sources - so I guess I can upload the file directly

Ah, no, the file is 1,9 MB, the limit here claims to be 4 MB (!?), so I can’t upload.
data ranges.ods (106.5 KB)

How to use it: Change the autofilters for another subset and display their values within the chart

works fine for me without re-editing (LO 7.5.8.3 gtk3)
or do I miss something ?

Did you try perfectly new filtered values? For me it had changed the data ranges.

But I’m still on 7.5.3.2. I’ll try with a newer version…

You are right - the 7.6.4.1 version does work better here.

It sometimes does keep the data range definition.
However, sometimes it does work even worse, changing my original data range from $E$1:$N$404 to $F$1… (column E is used for labels)

And sometimes activated auto filters from column C (two digits) and D (6 different text values) does limit the choices from column E (400 different text strings) to the matching subset, but sometimes it still does show all 400 values within the filter list.

So it seems to be work in progress, still with lots of bugs - or it’s me who is supposed to use filters in a different way than I do.

Data ranges still get reduced sometimes, but not any more every time.

I tried to use named ranges here now, too - but I suppose Charts are completely unaware of named ranges?

probably a bit of both :wink:
seems definitely not top robust to go safely all ways.

from what I could experiment, if you plan to add more rows, say 450, define directly your chart with E1:N450. Seems more stable, then draws directly when filtering.

apparently yep.

I’m not aware of any plans to add new districts, conquering some neighbourhood countries. It might be easier to give away some of the eastern territories to Russia in order to come down to 400.

<off_topic>

hoping die AfD won’t lead to another Anschluss :mask:
</off_topic>