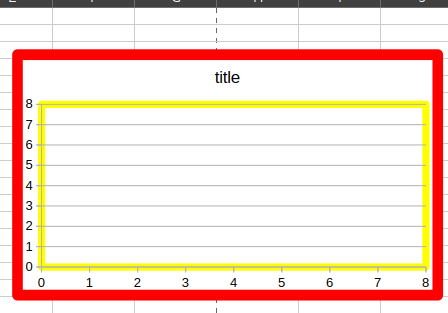
I cannot find a way, via a macro, to add a border to a chart in CALC. There is lots of information on adding borders to cells, but a chart does not necessarily sit on cell borders. I know there must be a way, I just cannot find it.
Thank you
John
where ?
this one Chart Wall ?
from Development Tools you can identify the relevant propertie(s)
LibreOffice: ChartArea Service Reference
 oDiagram = ThisComponent.CurrentController.ActiveSheet.charts.getByIndex(0).embeddedObject

   with oDiagram.Area
    .lineColor = &HFF0000
   end with

   with oDiagram.Diagram.wall
    .lineColor = &H00FF00
   end with

see also an extensive example at Cannot get my chart 'stacked' using a Calc macro
Thank you. It was the Chart area that I needed. I had gotten the Wall, but for some reason could not find “Area”. I did, however have to add:
.linestyle = com.sun.star.drawing.LineStyle.SOLID
to set the style
