Hi,
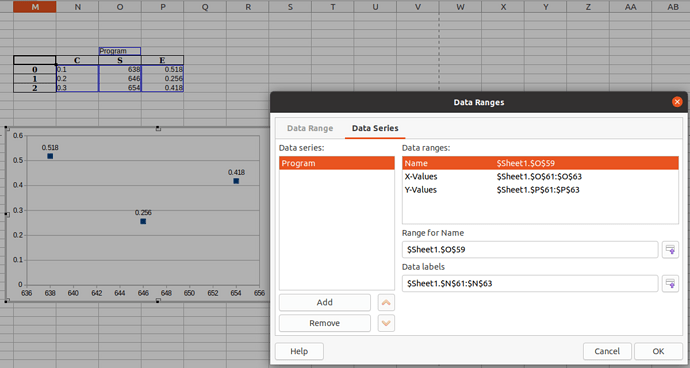
As you can see in the picture below, I have plotted E column vs. S column. I want to use C column as dat labels for the points. However, according to the figure, it doesn’t show them. Any idea how to fix that?
@Grantler
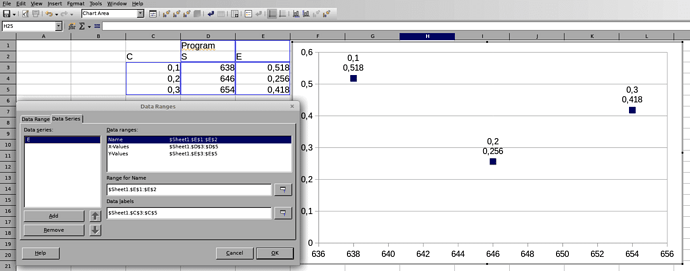
To be honest, I don’t see any difference except for the Name value. Does that really matter?
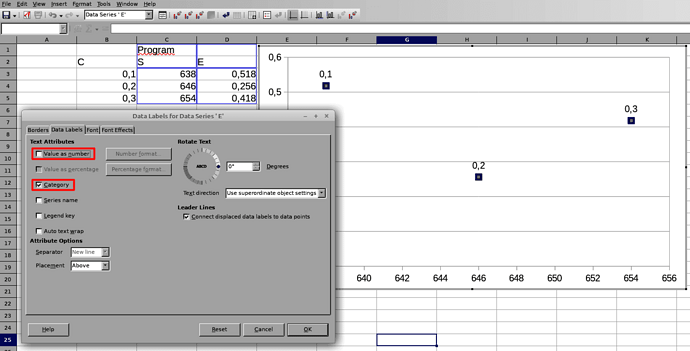
Also, may I know how to delete those 0.518, 0.256 and 0.418 numbers on the chart? I only want to see 0.1, 0.2 and 0.3.
@Mahmood
Is that what you want? Probably I did not exactly understand your question. Sorry for that.
Would you like a step by step instruction?
1 Like


