It would be helpful if someone could explain what the option “anchor to a cell (resize with cell)” means for a chart (or other graphic?) How does it differ from simply anchoring to a cell?
If the answer seems obvious, please bear with me.

It would be helpful if someone could explain what the option “anchor to a cell (resize with cell)” means for a chart (or other graphic?) How does it differ from simply anchoring to a cell?
If the answer seems obvious, please bear with me.
Anchoring in the cell means that when inserting or deleting cells above the anchorage the figure will descend or rise along with the cell.
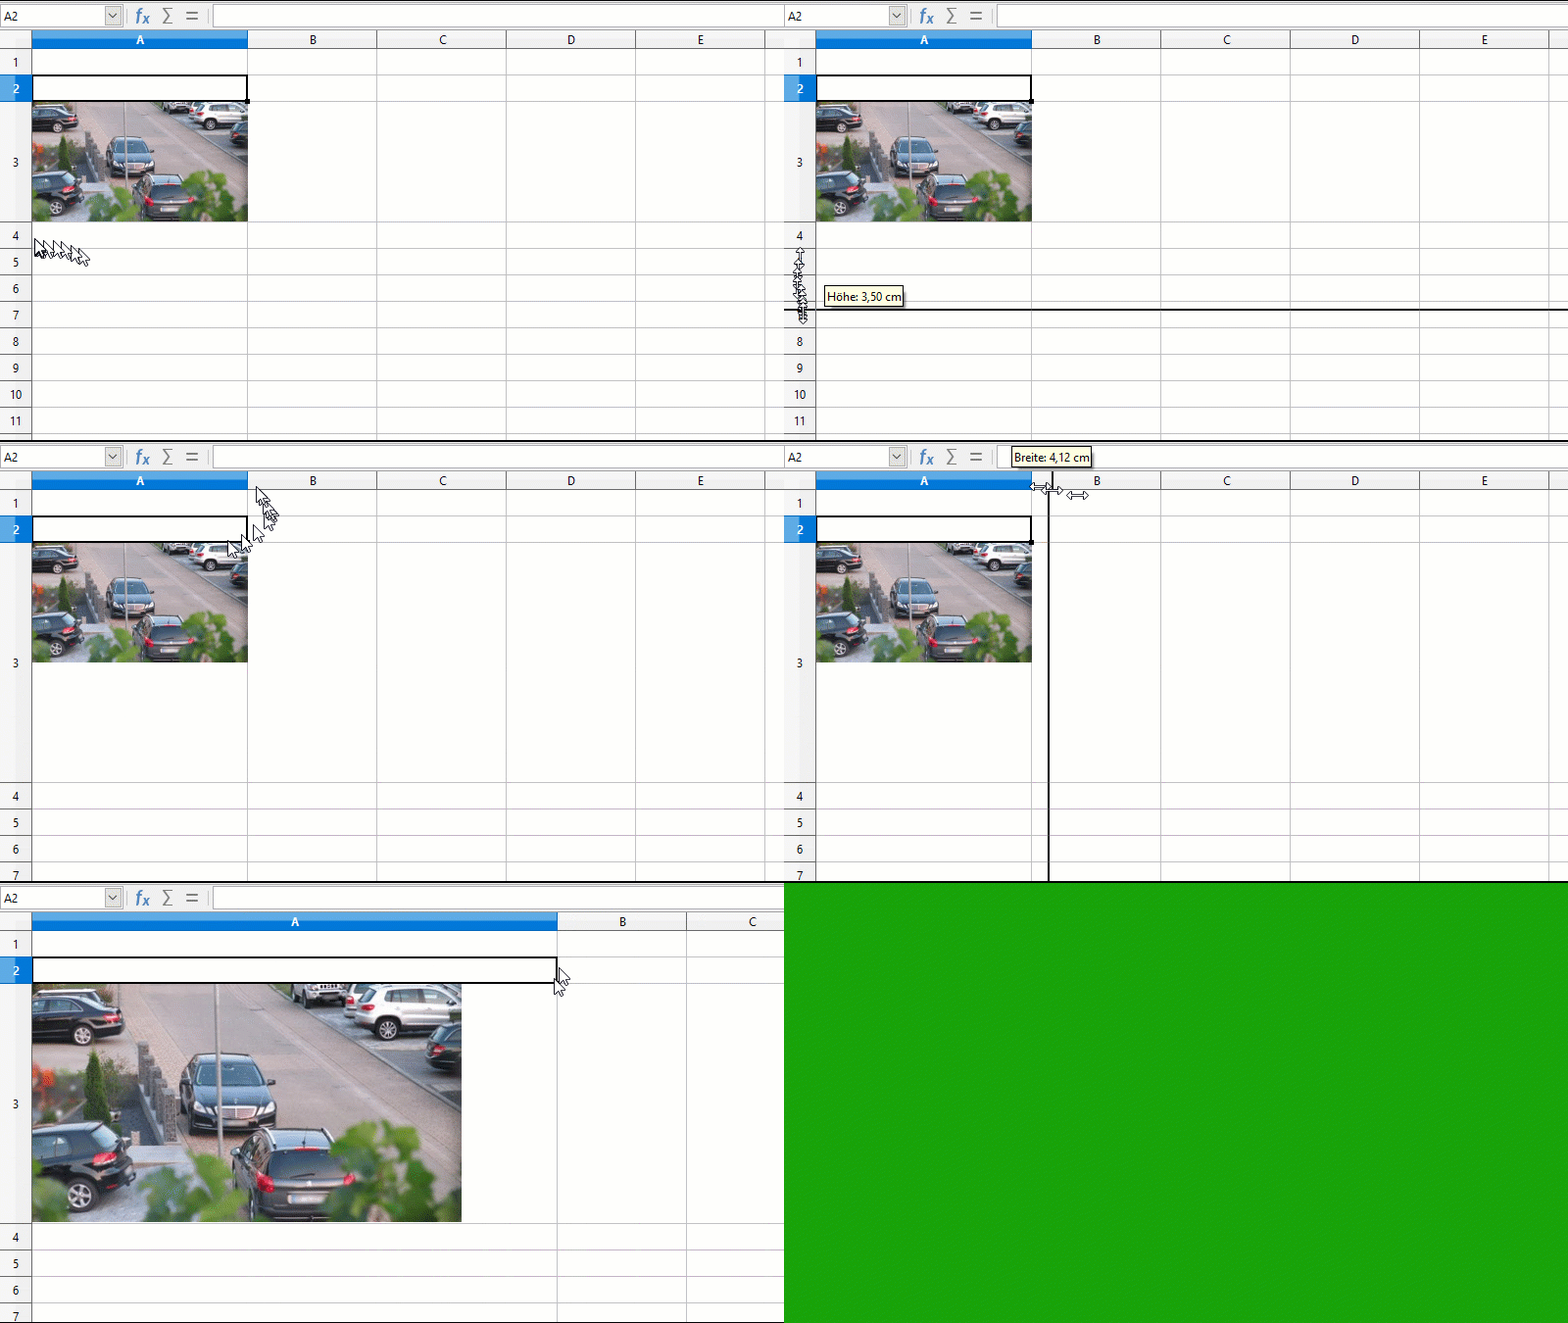
Redimensioning with the cell, it follows that by changing the size of some cell that is on the image, the image will be altered as well.
Take tests.
I had tried changing the size of the cell and did not see a difference in the size of the chart. That is why I decided to ask the question. I just tried it again and this time I do see a difference. Perhaps my eyes need checking.
Thank you.
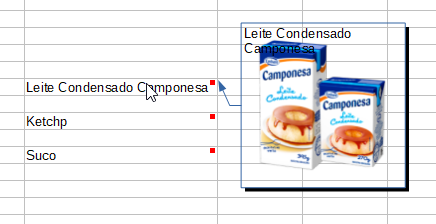
Taking advantage, I believe you do not know, it is possible to put image in annotation of cells, at a glance here:

Thanks again!
“anchor to a cell (resize with cell)”
It’s literally literal. As the cell grows, so does the size of the image. For example:

With me Windows 10 Home; Version 1809; 64-Bit | LibreOffice, Version: 6.2.3.2 (x64).
Wow. Didn’t know we could post videos like this. The answer looks so obvious now. Don’t know why I couldn’t see the change in size before I posted here.
It is a GIF file. The upload size is max. 1 MB. Nice that you like it.
And asking costs nothing except some time.