Why is Calc using '$' in data series when creating a chart? Absolute cells means I cannot add rows and columns(?)

Hi!

When I create a chart, Calc inserts data series (data ranges) as absolute cell addresses (using ‘$’). As far as I know, this means that I cannot add neither rows nor columns in my sheet, because that will destroy the absolute ‘$’ addresses. So why does Calc use them in the charts?

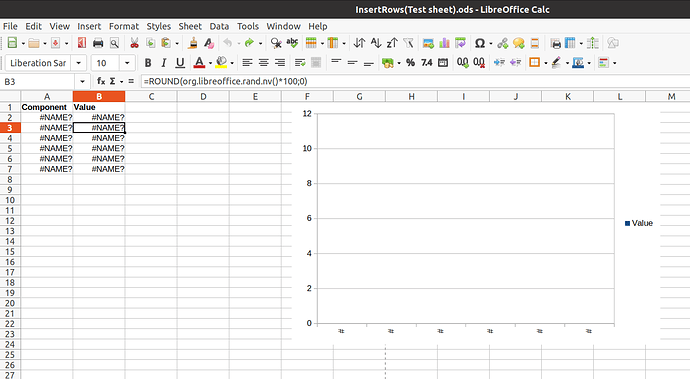
Did you try inserting rows? Feel free to add rows to this spreadsheet and copy down the formula, the chart updates. Make sure to add between first and last element in table.
Try moving the chart on the sheet, the values don’t change although the position of the chart has changed.
InsertRows.ods (14.6 KB)
The chart can be copied and pasted to a different sheet in the workbook and the new chart will still refer to the table on the original sheet and not fail because there is no table on sheet 2. That is thanks to absolute referencing. Cheers, Al

Strange… Now I tried inserting rows and columns in my sheet again, and this time there were no problems…
But I have problems with your test sheet. There are no values…:

Sorry. I used RAND.NV() which came in with version 7 I think. It is non volatile random number so it doesn’t change with recalculation.
For your spreadsheet, you might have turned off recalculation for the sheet accidentally. Anyway, good to hear it is working OK now

Also, just to mention, the chart is a different module’s object with a graphics anchor position, it asks Calc to hand out the data series and values for specific cell ranges, it has no connotation of relative cell references because it does not have a cell base position that could be used to resolve relative references.

1 Like