Why won't my Calc barchart show proper time with date?

I have two columns in Calc. The first column contains the date/time and the second one contains the value. This is what I get along X Axis of chart:

Input date to Calc Displayed value X Axis
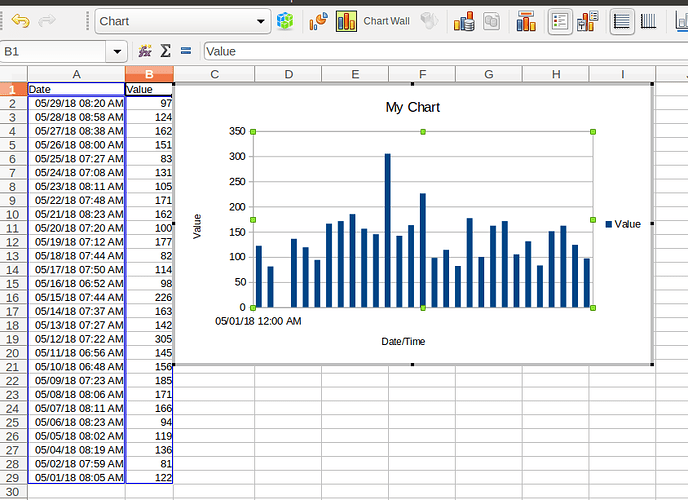
+ACI-May 29, 2018 8:20:01 AM+ACI- 05/29/2018 08:20:01 05/01/18 12:00 AM

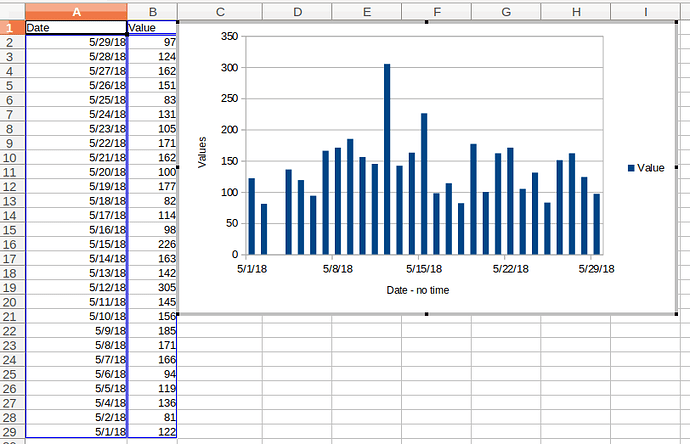
Note that dates range from 5/1 to 5/29

If I format the dates to show only the mm/dd/yy, then each day is shown.

If I format the date to show only the time, I just get successive numbers.

Basically, it is not picking up the date field correctly

With date formatted MM/DD/YY HH:MM AM/PM

With date formatted MM/DD/YY

With the below .csv file, dates are shown but time is shown as 12:00 AM instead of real time.

    Date,Level
    05/15/18 10:22:13 AM,67
    05/16/18 09:15:22 AM,42
    05/17/18 09:15:17 AM,133
    05/18/18 09:25:46 AM,98
    05/19/18 09:05:41 AM,75
Hello,

This is probably not the best solution but it seems to work:

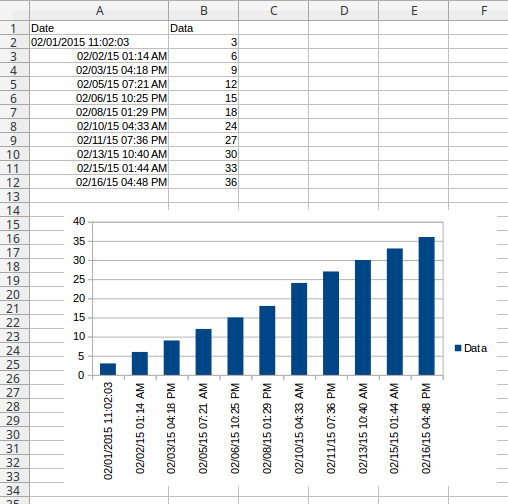
Notice the first Date/time in cell A2 - it is set as text ( using ' ). After doing this the rest display fine. Seems to be a bug. Check out Bugzilla & if not there please report.

(2nd revision) Perhaps your needs could be served by having both a chart and a table. The chart would show the general variation in the data, and the table would give the specific dates and times for each of your observations.

Still don’t understand the problem. The question description looks abracadabra to me… It would be good if someone understanding it would rephrase it, so that others would understand.

= DAY(A6) + HOUR(A6)/24 + MINUTE(A6)/1440 + SECOND(A6)/86400 is equivalent to = DAY(A6) + MOD(A6;1), because any datetime is just a float which measures days from epoch, where fractional part is fraction of a day. (The equivalency is only true for dates later than epoch, i.e. after 30 Dec 1899, because for negative numbers, MOD(negnum) gives a different result.)

@Mike2 : Aha! The more elegant solution! Thanks, Mike.

Just a note: please note that by using the @ with not full nickname, you have pinged another person :wink:

I do need the time information including hour and minute. Note, posting was updated to show images.

So - which is the result you need? (and please also provide a sample spreadsheet, so that we could test it)

There might not be enough room on the chart axis to display all of the information that you want. You might try formatting the x-axis, choose Label, then choose either Stagger Odd or Stagger Even. That will give you a little more space. You can also use a smaller font for the labels (Format Axis → Font), and/or make the chart physically wider, horizontally, (click and drag the dot in the middle of a border) to create more space along the x-axis. There are many ways to edit the charts.

For Mike Kaganski : Sorry, I forgot about the ping function. (withdraws, mumbling)

ve3oat, I expanded the chart and it makes no difference because, as you can see, although it shows the time in the first chart, the time is always set to 00:00. It doesn’t pick up the time from the data. Happens no matter how much I expand it. Thanks, anyway.

Note, I have updated Question with sample data.

Well, bar charts can be kind of funny. The label that you see in the first chart (“05/01/18 12:00 AM”) is a label on the x-axis and is not necessarily the x-position of the value being displayed by the bar. (That label marks the beginning of the x-axis.) That is why I had suggested using an x-y scatter diagram with calculated x being the “day + (time as a fraction of day)”.

Given the time span of your data (29 days?), your times will make little difference in the position of the bars.

Is it possible that your readers might be better served by giving them both a bar chart (to show the variation in measured values) and a simple 3-column table (date, time, value) to show them the actual dates and times of measurement?

To explain a little better – The labels on the x-axis show the scale of the axis, not the exact location of the bars or data points. Exact location of the data must be inferred by interpolation between labels on the x-axis. Your times vary so little, with respect to the scale, that any displacement of the bars is not really apparent.

What locale settings are you using? I ask because I am unable to find a setting that will correctly interpret the first column of your CSV file as a combined date + time.

Please refer back to the answer at the beginning, now majorly revised.