Hello all,
Been having a lot of trouble searching for modifying the defautly graph presentation to work with trend lines.
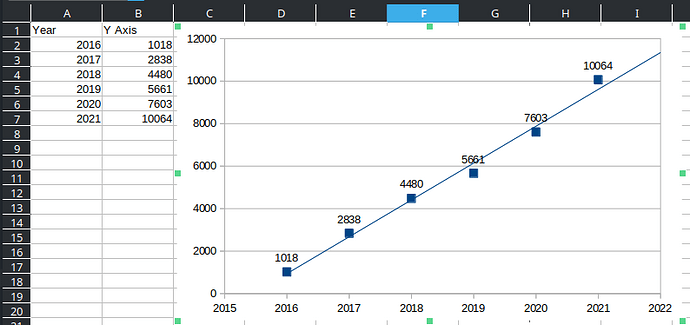
1) I need the graph to expand past my data to show the extrapolated trend line. I cannot figure out anyway to expand the graph without expanding my data. This seems to be a bug, if I tell the trend line to extrapolate into the future, why is the chart hiding this line?
-
The trend line should become dots or dashes then it is extrapolation (guess work) and not just a trend line. I think I can probably do this by using two tend lines one used dots and extrapolation, the other not
-
I want to put in extra axis (not sure right name for this) to show at what time the trend would intercept specific values. I imagine I can do some hacky thing with more data designed to jsut dray a horizontal line.
As requested here is my data and chart.
trend line.ods (87.8 KB)
I want the chart to show until 2030ish. So it needs to expaand on the X axis and the Y axis to continue showing teh trend line.

