Z-Axis Value in Calc

I am trying to do a 3-axis chart in Calc and can’t figure out how to assign a value to the Z-Axis. When I try to edit a data range, I get the fields to modify the name and the y-axis value, but I can’t figure out how to use the Z-Axis. Perhaps I am not laying out the columns on the spreadsheet correctly? Any help would be greatly appreciated

==Edit for more detail==

Sorry, I should have used images in the first place and avoided the confusion.

I am trying to get something along these lines: http://www.mathworks.com/matlabcentral/fileexchange/screenshots/6603/original.jpg

but when I try to make a 3D bar chart I keep ending up with ones that look something like this:
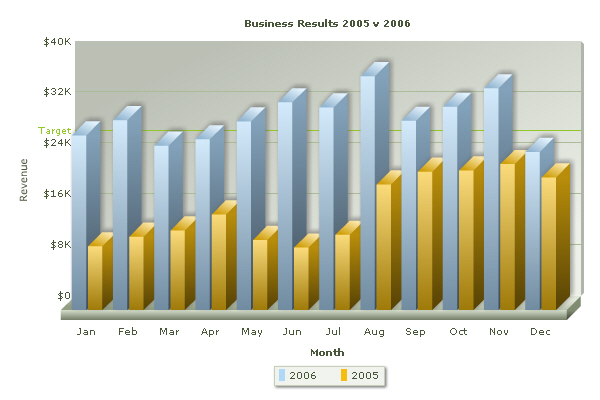
which is a 2D chart with a 3D graphic, not an actual 3-axis chart. What am I missing? How would I lay out the spreadsheet to get the result I want?

I am not sure if I understand you correctely; a 3-axis chart is relatively easy to make; see a question by me:

Or did you mean how to format axis → scale as in 2D-charts? When I try to modify both the X and Z axis, I only get “Line”, “Label”, “Font” and “Font effects”, too.

I can modify the scale (say 10 or 100) for the vertical (Y) axis only, the other two are set by the data range.

To add to this answer, the Z-axis / Z-coordinate is defined in ODF v1.2 for chart:class of chart:area (Area), chart:bar (Column/Bar), chart:line (Line), and chart:scatter (XY Scatter) in accordance with the 3D setting.

Where chart:deep="true" the z-coordinates are generated from the order of the series elements starting with 1.0. The first series has an associated z-coordinate of 1.0. The second series has a z-coordinate 2.0 and so forth. The series names are used as labels at the z-axis.

The definition for the chart:surface (not yet implemented) is further dependent on whether the cell range address includes more than one range.

Sorry, I should have used images in the first place and avoided the confusion.

I am trying to get something along these lines: http://www.mathworks.com/matlabcentral/fileexchange/screenshots/6603/original.jpg

but when I try to make a 3D bar chart I keep ending up with ones that look something like this:

which is a 2D chart with a 3D graphic, not an actual 3D chart. What am I missing? How would I lay out the spreadsheet to get the result I want?

Again, please check out the example in my first link. There you have a chart that is as close as you can get. Note that you can drag and rotate the axis (almost) as desired.