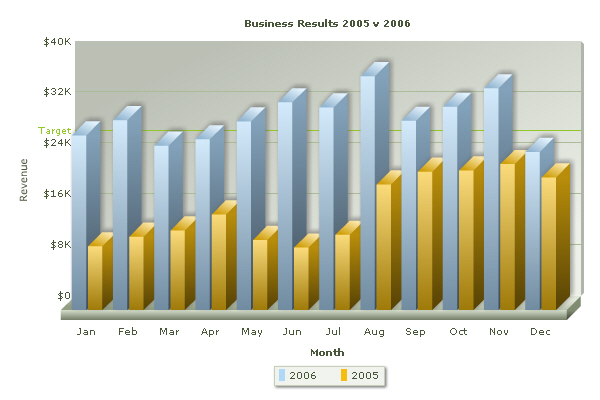
I am trying to do a 3-axis chart in Calc and can’t figure out how to assign a value to the Z-Axis. When I try to edit a data range, I get the fields to modify the name and the y-axis value, but I can’t figure out how to use the Z-Axis. Perhaps I am not laying out the columns on the spreadsheet correctly? Any help would be greatly appreciated
==Edit for more detail==
Sorry, I should have used images in the first place and avoided the confusion.
I am trying to get something along these lines: http://www.mathworks.com/matlabcentral/fileexchange/screenshots/6603/original.jpg
but when I try to make a 3D bar chart I keep ending up with ones that look something like this:

which is a 2D chart with a 3D graphic, not an actual 3-axis chart. What am I missing? How would I lay out the spreadsheet to get the result I want?
