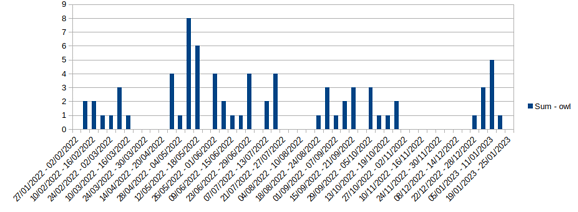
Zero values are not being plotted in a chart

I have a spreadsheet that holds the daily sighting for a number of animals. Each row represents a day, the first column being the date. Many of the cell values are blank, indicating zero.

I want to aggregate daily values by week, and then produce a chart. I’ve created a pivot table with weekly values, but the chart is ignoring rows that have a zero count. I want them included. How do I do that?

Double-click the chart for editing.
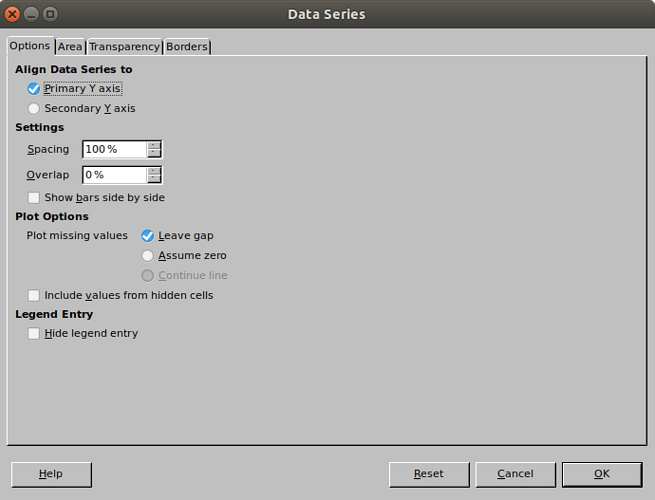
Double-click the series (bar, line, area representing the values) for the properties dialog. On the first tab you find option about handling of missing values.

Depending on where I double-click within the chart I get different dialogs, but none that offer me a properties dialog.

The different areas I can select within the chart to bring up options dialogs are: Chart area (the whole chart), Chart Wall, Data series (the values themselves), y-axis, x-axis. Most options relate to appearance. When I double-click Data series, I get a dialog where the first tab is Options (the rest are appearance related). The only likely looking option is “Plot missing values” for which I can select “leave gap” or “assume zero”. Neither of these has any effect.

I’m using LibreOffice Version: 6.4.7.2, on Linux.

The Blank cells and the Zero values in the cells are basicly different things in a spreadsheet document. The simpliest workaround: type-in the zero values too.

A properties dialog shows all the properties of a selected object.
When you double-click a chart, you open the chart for editing (technically it is an embedded thing of a different kind). A chart toolbar should pop up where you can select chart elements from a listbox. Chart Area, Legend, x-axis, y–axis, you need a data series. The toolbar button next to the listbox shows a properties dialog. Its title should be “Data Series” indicating the type of the selected object.

1 Like

Yes, that’s the dialog I’ve been using, to no effect. However, after a lot of experimenting, I’ve discovered what’s happening although not why.

If I have something within the pivot table columns selected when I insert the chart, I get a chart with an immutable data series called “Total”, which also does not plot the zero or missing values and ignores the plot options settings. However, if when I insert the chart I have a cell outside these columns selected, I get a chart where the data series can be edited, and is already showing the zero points that were previously missing (and a more meaningful legend).

This may be intentional behaviour that I don’t understand. Or I suppose it could be a bug