Example:
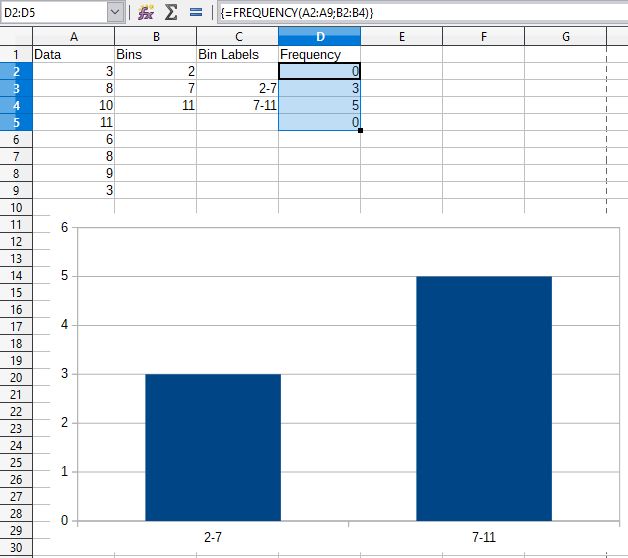
Data      [2-7] [7-11]
Frequency [3]   [5]
The histogram should look something like this.

Example:
Data [2-7] [7-11]
Frequency [3] [5]
The histogram should look something like this.
Welcome to the site! Take a look at guidelines for asking. I made many changes to the question, so please edit it if anything is incorrect.
In Calc, add a column for bins (2,7,11) and then another column for the FREQUENCY function. I also made a column for bin labels to make it look better.
Then select C3 to D4 and go to Insert → Chart.
Download: Sample file.ods
To do this in Writer, either go to Insert → Chart and copy the data, or go to Insert → Object → OLE Object and select the Calc file.
This answer was adapted from a similar question at Plotting histograms in calc?.
Thank you for the answer and sorry for the question format, it’s my first time.