
Where a wet spell (a useful amount of rainfall; breaking a drought) is arbitrarily defined as a period of time not longer than 6 days having a total of 30mm or more rainfall. The data is mm rainfall and the date of the event. Please see attached.dates with rainfall.ods
Which data do you have? How it is formated?
Click edit below your question and use the paper clip to upload a sample file (remove all sensible data before).
Probably by using a helper column with a “running precipitation” record.
How is your data laid out, to base that calculation on? Preferably, edit your question posting and attach a spreadsheet file with your data.
@carob, Given 7 consecutive days, each with 5 mm, what day is the end of the wet spell? How many days make a dry spell?
@carob, Given 7 consecutive days, each with 5 mm, what day is the end of the wet spell? How many days make a dry spell?
Given 7 consecutive days, each with 5 mm, what day is the end of the wet spell? The 7th day would be the last day of the wet spell.
How many days make a dry spell? That wasn’t separately defined so would be the period between wet spells.
Thanks for your continued interest. All these ideas enable different ways to visualise the data as “growth periods” which is just for personal interest
I share an (in-process) option. I need more info (see my last comment).
- In C2:
=IF(AND(A2<A3-5;SUMIF(A$2:A2;">="&A2-5;B$2:B2)>=30);A2;"--") - In D2:
=IFERROR(IF(C2>1;C2-VLOOKUP(C2-1;C1:C$2;1);"");"--")
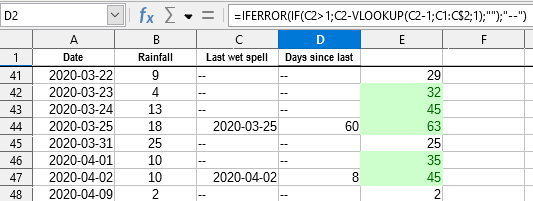
See sample file.
Tested with LibreOffice 6.4.7.2 (x64); OS: Windows 10.0.
Add Answer is reserved for solutions. If you think the answer is not satisfactory, add a comment below, or click edit (below your question) to add more information. Thanks.
Check the mark (![]() →
→ ![]() ) to the left of the answer that solves your question.
) to the left of the answer that solves your question.
If the answer helped you, you can mark the up arrow (![]() ) that is on the left (to vote, you need to have karma of at least 5).
) that is on the left (to vote, you need to have karma of at least 5).
I moved your data into the sheet I had prepared. See attachment.
ask286477movingPartialSum_1.ods
It uses one relevant helper column (Cf. @keme), and I wold strictly dissuade from attempts to do it without.
Just had another look on the data from OQer’s file. They don’t make sense.
The given task obviously requires data for a contiguous sequence of days.
Thanks for this solution and for the interest shown by everyone. Although this answer isn’t quite what I was looking for it will be an easy matter to insert the days with zero rainfall into the data which I think will then show which periods during the years had a good amount of rainfall
To expand the list to one containing the days unbroken is recommendable anyway, but next to indispensable for the evaluation.
Leaving out a day due to 0mm precipitation would cause doubts if not a system failure skipped a day with 123mm.
For the evaluation it would mean the need of a lot of matching like
=SUMPRODUCT($B$2:$B$376;ABS($A$2:$A$376-$A132+2.5)<3) in row 132 (e.g.) for the 6-day-precipitation, always evaluatimg the complete range which surely has more than 6 positions (as the OFFSET range has).
Well, if there aren’t lots of additioanl calculations, and you can assure my first counterargument to be obsolete, you might calculate the moving accumulation of 6-day percipitations the second way…
But where would you place the final “number of days since…” Mainly for a long draught this should be relevant, and many of the respective days woudn’t be listed without the expansion. I really don’t understand.
Another solution which uses a helper column but without the need to include days with zero rainfall could have the following formula copied down from the top of the helper column
=SUMIF($A$2:$A2,">=" & DATE(YEAR($A2),MONTH($A2),DAY($A2)-5),$B$2:$B2)
where column A is date and B is rainfall
However the data does make more sense as previously stated by including zero rain days