Finding peaks in x,y data

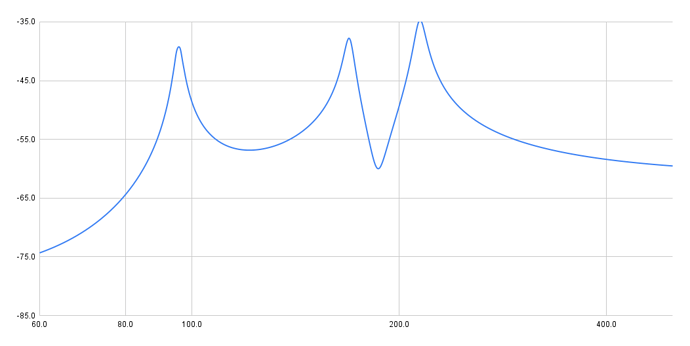
I have two columns of calculated values, x and y, 5000 rows. If you graph it, it looks like a three-humped camel–i.e. it has three local peaks in the y values.

As I change various inputs to the calculation, the locations of the peaks changes (i.e. a peak in the y value will appear at a different x, a different row).

I can identify the peaks with a formula like this:

=AND(OFFSET(W6, -1, 0)<W6, W6>OFFSET(W6, 1, 0))

This looks for values of y which are greater than the one before and the one after.

What I want is to produce a 2x3 array of the three x,y pairs where the above expression is true. This can’t just be a copy&paste since the rows at which these peaks occur changes. In fact, it can’t be a manual process at all, since there are further formulas which work on this 2x3 array, so I need those to recalc when the peaks change, no human involved.

I did this in Google Sheets with a named function:

name: FIND_PEAKS
parameters: x, y
Definition:
=REDUCE({0,0}, y, LAMBDA(accum, curr, 
    IF(AND(offset(curr, -1, 0)<curr, curr>offset(curr, 1, 0)), 
        VSTACK(accum, {INDEX(x, ROW(curr)-ROW(x)+1, 1),curr})
    ,
        accum
    )
))

Unfortunately, REDUCE and LAMBDA are not supported in LO Calc.

Is there another way?

I’ve attached the spreadsheet.

Medium SS.ods (66.1 KB)

Look at cell model!B65 to see what the desired result should look like. The x,y pairs are in sheet “freq_db”, and are labeled “f” and “db”.

Thanks for any help you can offer.

Greg

Cross posted from the OpenOffice forum where at least one response has been made.

If you cross post, as a courtesy please let us know that you have done so, otherwise it leads to several discussions and a waste of time because several identical answers may be posted by different users.

1 Like

Over on forum.openoffice.org, user MrProgrammer provided a solution using the MATCH() function.

Check it out here

Greg

Do you mean with 2×3 array the comparison between cells above and below? In my example file i have deleted all sheets and cells i don’t need.
Medium SS_return-v0001.ods (33.8 KB)

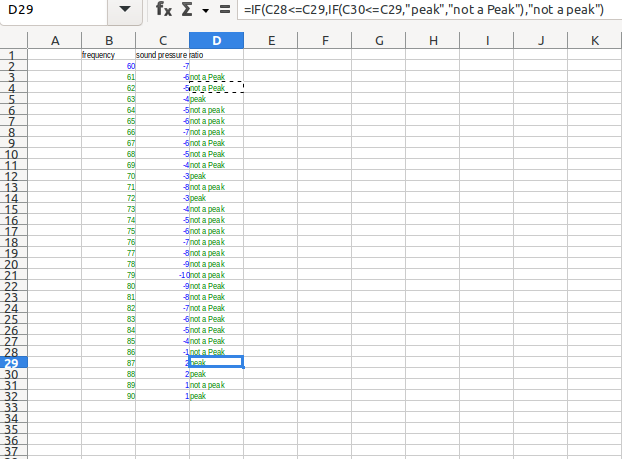
I have tried something like this:
image

Hey guys, thanks so much for the help! I really appreciate it.

It looks like you both attacked the problem of identifying the peaks. This expression identifies the peaks just fine:

=AND(OFFSET(W6, -1, 0)<W6, W6>OFFSET(W6, 1, 0))

To see what the solution should look like, look at the cells in sheet ‘model’ B67:C67. It should look like this:

Screenshot from 2024-02-27 09-56-21

The solution should extract these three pairs from the sheet, ‘freq_db’, without modifying that sheet. In other words, it can’t delete rows. Adding a column is OK.

It should do this without any manual steps. That is, the 2x3 must be automatically updated when the data in the ‘freq_db’ sheet is recalc’ed. And keep in mind that when freq_db is recalc’ed, the the peaks will move–i.e. you can’t hard-code the row numbers to generate the 2x3.

Thanks,

Greg