Add a drawing to a chart in calc and anchor it to a point in the chart

Hi All,

I have a spreadsheet with several charts. I would like to annotate a point (or points) in the chart, but when I add a callout or an arrow, it moves when I add new data to the chart. How can I anchor the drawing object to a point in the chart?

A secondary problem is that I have not yet discovered how to modify the drawing object. By which I mean I cannot select it if it is in the middle of a chart. The only way I’ve discovered to do that is by shrinking the chart until the drawing object is not on it any more but “on” the spreadsheet itself, then I can select it. So does that mean the drawing object is anchored to a cell in the sheet the chart is on, not the chart?

All advice gratefully received.
:slight_smile:

You can select any object by double-clicking it in Navigator in the Sidebar. It is easier to identify the object if you rename it with a relevant name

IMO this problem is not the only one. If adding a drawing object in a chart you may locate it at the right point. When scaling the chart it will not “stay” at its defined place. So bear in mind to add a drawing object just before finishing the chart’s customization.

Thanks for the replies. @EarnestAI (I hope you are a human…) that solved the selection problem. Thanks.

@Grantler, yes I have noticed this behaviour too. In my case I’m modifying the charts every day by adding new daily data, so the drawing objects slowly drift away from the point I’m trying to document.

On the upside I may have found a solution. I found that, if I zoomed in to the chart so I could click on the point I wanted to attach a callout too, it does seem to move with the chart. The point on the chart is not highlighted in any way, and of course there’s no snap to it, but if you can be reasonably certain of clicking on the point (by zooming in so far that the point is very big) then it seems to work. On the downside, the object does not appear in the navigator for selection, so once it’s there you’re stuck with it…

I haven’t been able to find anything about this in the documentation, so maybe it’s an “undocumented feature”? Maybe it’s a work in progress. The functionality is there but the user interface part is yet to be implemented in a more robust fashion?

:face_with_diagonal_mouth:

The object will move with the chart but not with the data points. In the sample below, If I delete the first 5 rows, the callout will no longer be pointing to the original point.
RandomDataChartWithCallout.ods (29.1 KB)
Note that the callout can be selected when editing the chart (double-click the chart and then click on the callout, or if it has transparent fill and line, click on the words).

If I insert a drawing object in a spreadsheet embedded in Writer as OLE object, it will appear in Navigator only when I am editing the OLE object.
It looks as though Charts are OLE objects but there is no Navigator for it, only Properties. Even the floating Navigator (F5) disappears.

1 Like

Just a tip:

Double Chart with labels.ods (21.0 KB)

I can show you some other available features of these labels:

  • Border lines
  • Border line color
  • Font color
  • Connection lines
  • Manually moved labels

Double Chart with labels_2.ods (23.4 KB)

Try to change some x values. The labels will move together with the nely calculated y point…

2 Likes

@Zizi64 that is exactly what I want to do! How the heck did you do it? Is there anything in the manual about how to do it? I have not been able to find anything.

:star_struck:

I just used the existing features of the Charts. There is a Scatter diagram in my sample file with a secondary chart, what has same (referenced) y data than the primary has.

  • Create a secondary chart for the custom labels. (The primary chart shows the Values labels, and the secondary one shows the Custom labels. Because the two charts have same curve, the primary one will cover the secondary one).

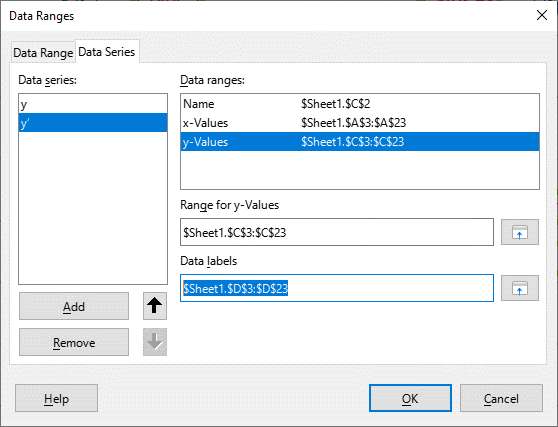
  • Then set the Data Ranges - Data series of the chart y’: Data Labels. Use a helper column (the column D in my sample)
    Set Labels 1

  • Make visible at least one data point of the secondary chart for clicking on it: modify the referenced value of one point. For example modify the referenced y’ value from 0 to 10 manually). You can click on the red chart now. And you can set the line width, color, and the points type/size of both charts.

  • And then use the “Insert - Data Labels” feature for the secondary chart:

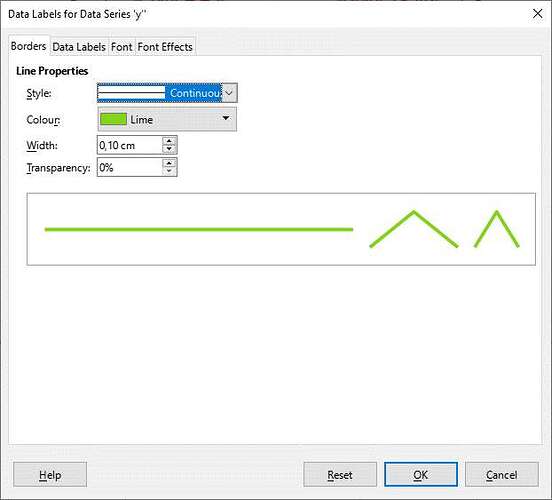
  • On Tab “Borders” you can set the line style, width ad color of the border line for the labels of secondary chart:

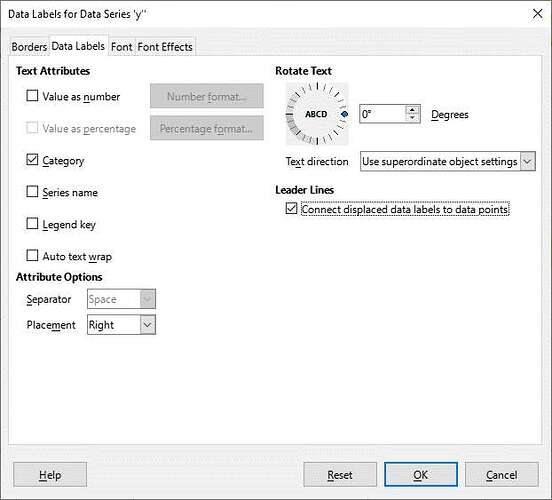
  • Onthe Tab “Data Labels” you can set the source of the label strings by coosing the option “Category”, and you can set the visible connection lines by chacking in the option “Connect displaced data…”. And you can set the relative position of the label texts (to the datapoints - left/right/below/above):

  • And finally you can set the color of the label text on the last Tab.

  • Then drag away the labels manually on the chart area to the desired positions.

  • Fix the reference of data of the modified point of the chart y’ (in Column C), to hide the curve again.

If you not need the numeric data labels, then you can use only one chart line for this task.

@Zizi64 thank you so much for the detailed instructions. It’s going to take me a bit of time to work through them, what a complex procedure! I’ve never used secondary charts before, so that will be a whole new adventure.

:wink: