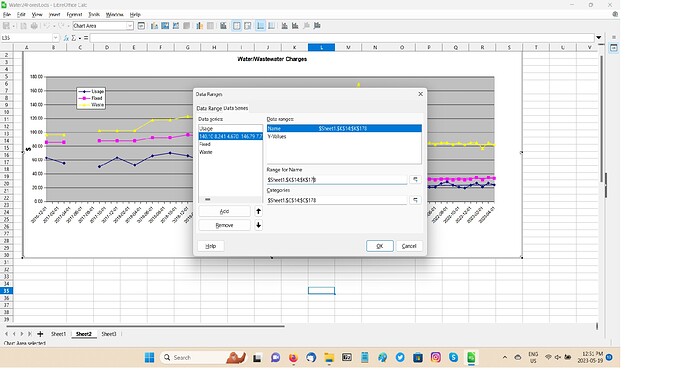
With 6.2.0.3 I cannot add a new data series to a chart if the data series is on another sheet from that file. It does work if the data series is on the same sheet. This works on 5.4.6.2 . Has this operation changed? I double click for edit mode, select data ranges, data series, add, select range for name, click on cell in other sheet for name and nothing happens. Also fails in safe mode.
Since 5.4 I have found serious issue with each new release keeping me on 5.4. The bad thing is I don’t see others having same problems. During this time I have reinstalled Linux Mint and should have cleared OS problems. Any ideas?
ADDITION:
In creating a simple spreadsheet to submit a bug. I found it does fail doing my method of having both the sheet with the chart and the sheet with the data open. However having only one sheet open and selecting the 2nd sheet when needed it works. I will do more testing.
Version: 7.5.0.3 (X86_64) / LibreOffice Community
Build ID: c21113d003cd3efa8c53188764377a8272d9d6de
CPU threads: 4; OS: Windows 10.0 Build 22621; UI render: Skia/Raster; VCL: win
Locale: en-CA (en_CA); UI: en-US
Calc: CL threaded
I have a similar problem - I cannot Add a data series in Sheet 1 to an existing line chart in Sheet 2.
When I click Data Ranges within the chart and then click Add under the tab Data Series LO creates a new series called “Series” and gives it the name “Name” under the heading “Data ranges:”. It isn’t possible for me to edit or replace these assigned names. If I ignore that and go ahead and try to enter a range of cells for the data then LO replaces the word “Series” with the data from the range in Sheet 1 and enters the range beside “Name” under “Data ranges:”. This spreadsheet was originally an Excel document which I loaded into LO Calc, if that makes any difference. Also note that LO reports I’m on Windows 10 but I’m actually on Windows 11 22H2, if it matters.
I can.
Version 7.4.7.2 on Windows 10.0
Would you share your file to test?
Sure.
How do I share it?
In the same way how you shared the picture.
Ok, I didn’t know if it should go to the cloud or to the individual or if LO has a repository for uploaded files…
Water24Forest2.ods (57.0 KB)
First of all, I switched the chart type from “Line” to “X-Y-Scatter” in order to get a numeric scale on the x-axis without time loops.
Then I added the “Total” series analog to the other three series.
All I want to do is add a data series call Total and have the data come from column K of Sheet 1.
Thanks @Villeroy - I had added my comment about column K before seeing your reply.
Thank you very much for the solution!

