Add extra lines where crossing 2 values in chart

Hello,
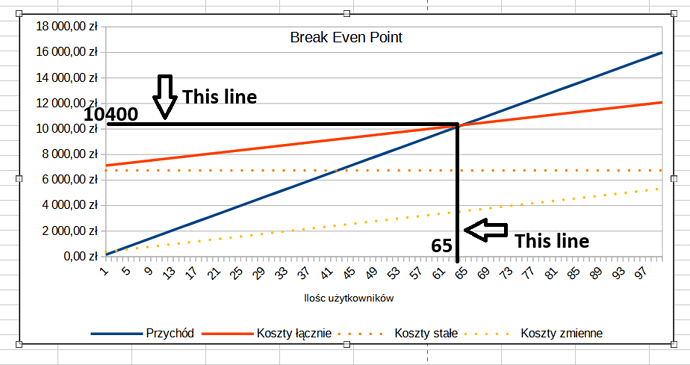
I want to add 2 extra lines(with highlighted value) where two lines in chart are crossing, best would be if the lines where dynamically adjusted, can you direct me how i can achieve this?
This is what i want do make (added those lines in paint):


This is my calc with chart:
Obliczenia.ods (35.6 KB)

I want add them only to solid line’s, dotted are just some extra information

Are you sure that always there is equal y values for the line pairs in the data tables, or the crosspoint(s) must be calculated induvidually?

it’s part of my university assignment so therefore it can scale to infinity
i can change values of money and cost (but probably not at this point - it depends on my professor mood…)
basically formulas are:
money*number of users = Przychód (K column)
cost*number of users = Koszt łącznie (L column)

It would be cool if changing some of cost/money values chart would update to new cross point, if there would be not cross then it’s still “good answer”
There should be only one or none cross point

Crosspoint by ErrorBars:

CrossPoint_by_ErrorBars.ods (35.4 KB)

3 Likes

Thanks!
Is there a way to add numbers to highlight value of those ErrorBars?

Maybe it is possible by usage some more tricks:

Try to draw the crosspoint as an individual “one point graph”, and set the Data Labels for the only one point.
Unfortunatelly the Label will be locatad near the point but not near tthe axes.

Here is an attempt to the solution, but it is far from perfect:

  1. I calculate the absolute difference between the red and black lines (range M7:M106)

  2. I store the minimum of M7:M106 in M5. This is the “crossing point”, but it is approximated based on actual values and not calculated mathematically with the equation of the two lines. Here, the minimum difference is 49 Zt, so it is not too visible on the graph.

  3. I store in N5 on which index of the range M7:M106 the minimum value is reached. This will be the “x” of that point.

  4. In N7:N106, I put either the value at the crossing, either 0, either nothing to simulate the line. Note that the vertical line is not exactly vertical because it goes by one increment of x.

  5. I don’t know how to display dynamically the values on the chart.

  6. If there is no cross point, I don’t know what happens. Maybe the universe collapses, so test it with care!

Obliczenia.ods (38.7 KB)

2 Likes

thanks! unfortunate the vertical lines need to be straight :frowning:
I will toy with your solution :slight_smile: maybe i will find what I need :slight_smile: