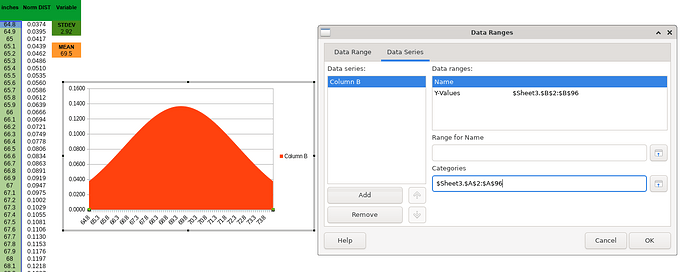
Area Chart - How to display a relevant 'x axis' instead of 1,2,3,4

Hello everyone :slight_smile:
I am hoping somebody can help with this chart problem.

To create the chart I selected the norm.dist range, and the corresponding inch range.
The chart displays the x axis as 1,2,3,4…267
1 to 267 has no relevance.

I spent about an hour looking for a way to change the x axis, but for the area chart, there is no x axis option (like there is on scatter charts).

The inches are to ‘one decimal place’, so I would like to set the x axis to display inches in increments, so that they are legible on the chart.

How is this achieved? :slight_smile:

Please upload a small ODF type sample file here.

1 Like

You can see that the y-axis is not required … I’ve left it for reference.
The x-axis appears to relate to a count of the data rows, which is meaningless for the purpose of this chart.
Hence my query on how I might create an x-axis that relates to inches.

Note: This is a reduced data set … the curve would normally be a complete ‘bell’.

Area Chart x-axis sample.ods (30.9 KB)

You can use “Categories” in the Data Ranges configuration to define the displayed values in the X axis.

2 Likes

Thank you very much, for that solution.
I figured that there must be a way to display a relevant x-axis … but I couldn’t figure out how.

Seeing your solution made me very happy :smiley:

:heavy_check_mark: