Hello
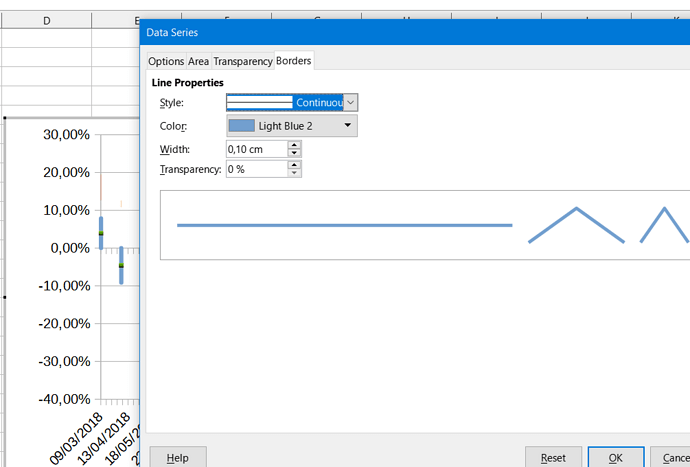
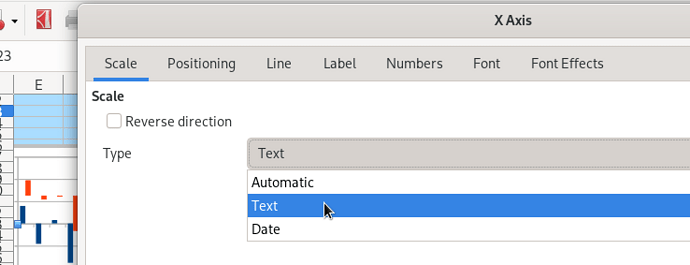
I’m probably missing something obvious. However, no matter what I do, I don’t seem to be able to change the chart column width. This is also making it difficult to know if the side by side feature is actually working.
Here is my spreadsheet.
Show bars side by side is checked.
I’ve played around with spacing, overlap, and attaching to different axes, to no avail.
I’m using LibreOffice 7.4.2.3, installed via Snap on Kubuntu 20.04LTS.
Can anyone suggest where I’ve gone wrong?
Thanks so much.
column_chart_side-by-side_problem.ods (57.1 KB)


