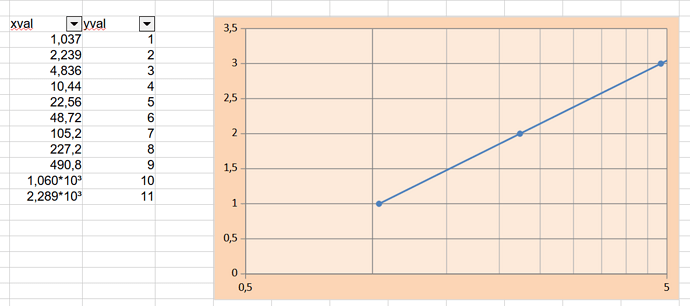
With CALC, I am charting data using a logarithmic scale on the y-axis. I wish to display only in the range from 1300 to 1800. No matter what I try, I can only get a single axis marker at 1300. I would like other markers to be shown at 4 or 5 more values. Any suggestions?
I think I understand the help text but this does not solve my problem.
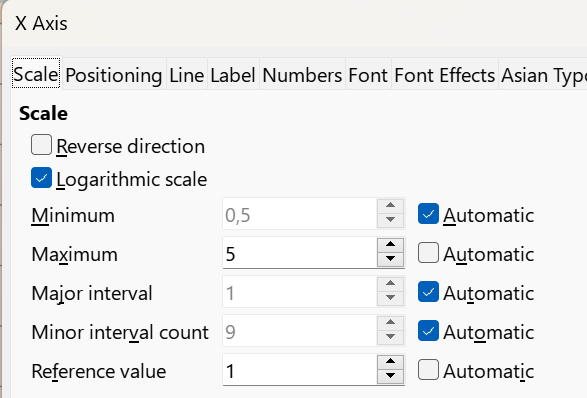
I have formatted the y-axis scale:
Logarithmic
Minimum 1300
Maximum 1800
Minor Interval Count Automatic
…and the chart is not affected when I set the Major Interval set to Automatic, 1, 10, 100, 1000 or 10000. The chart still only shows a single marker on the y-axis at 1300.
Many thanks,
Mark.
If you set the Major Interval to 0.01 you see multiple values on the y-axis. No rounding, however


