Calc Charts -- Data labels, lines

Several questions about problems I’m having making charts in Calc.

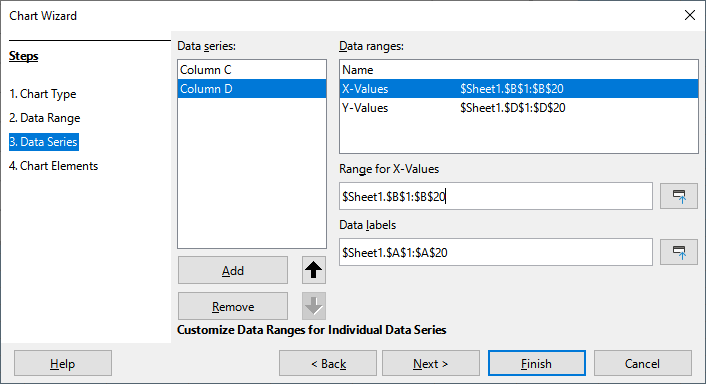
(1) I have an X-Y scatter (a map, long & lat). I have two different series plotted, with two distinct ranges for X and Y. But it won’t let me have separate ranges for data labels. If I change it in one series, it changes in the other. How to do this?

One thing that comes into mind is just plot it all as one series, leaving gaps. But then other issues arise:

(2) I want one series to be lines with no icons, and the second to be icons with no lines. That’s easy to do if you have two series. If I do it all as one series, how do I change lines and icons for individual points? In Excel, for example, I could click on a line between two points and have that one single line segment removed (or made thicker or whatever). I could also change the formatting of icons for individual data points that way (say, having all the icons as squares, except one as a triangle). Is that possible in Calc? I haven’t found a way yet.

(3) Is there a way to click on a label for a specific point and type in my own text?

  • One column with all labels.
  • One column with all X values (longitude?)
  • Two columns with Y values
  • Select all data, choose menu Insert - Chart - XY (Scatter)
  • Copy Y-Values in Data ranges for Data series Column B
  • Remove Data series Column B
  • Paste in X-Values in Data ranges for Column C and Column D Data series
  • Finish

See sample file.
2XY series.ods (27.8 KB)

  • Edit the chart
  • Secondary click on one data point, choose Format Data Series… - Line tab and change accordingly
  • Secondary click on one data point, choose Insert Data Labels
  • Secondary click on one data point, choose Format Data Labels… - Data Labels tab, unselect Show values as number, select Show category, OK

I think that is is not possible.

Hi:

The solution you presented works well.

It’s really wasteful of spreadsheet space, though. Especially if you have multiple sets of x-y where the x’s are not the same but which you want to put on the same graph.

What if you had data from two different sheets that you wanted to put on the same graph?

Thanks for your help
Gerald Eisenhower

Almost, but data labels are taken from the same range. :frowning:

See 2XY series 2sheets.ods (22.9 KB) and 2XY series 1sheet.ods (27.3 KB).

There is a not easy workaround: use two sets of data and two graphs superimposed.

2 Likes