Calc image not display layers properly

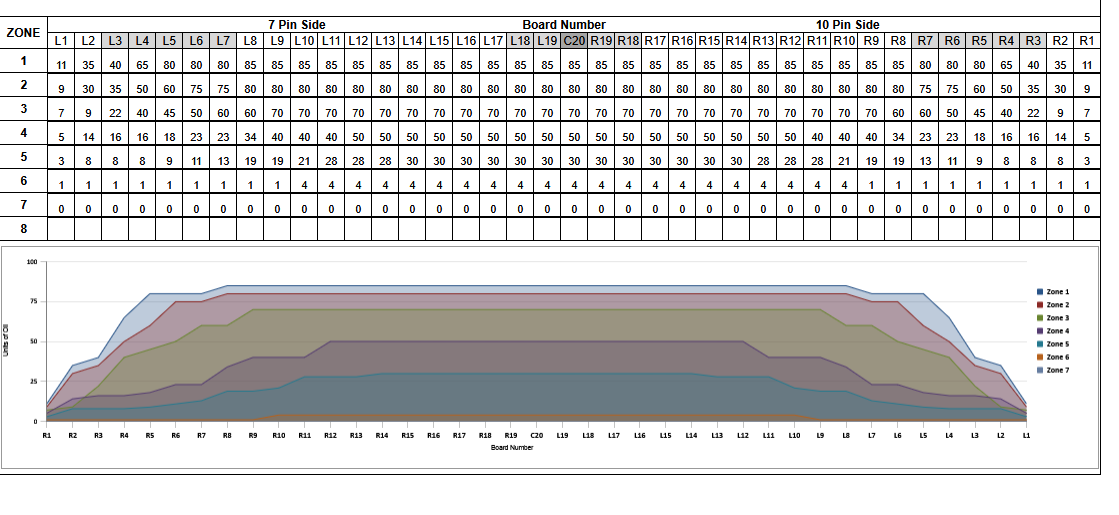
i have a spreadsheet of brunswick lane oil patterns. the layers created do not display properly in libreoffice. they do display correctly in excel & google sheets.

this is what it should look like. file of actual spreadsheet is attached also.

25ROOSTER46.xlsx (527.7 KB)

thank you. robert.

Hi Robert and welcome!
You mean in Calc it should look like this? 25ROOSTER46.ods (555.2 KB)
It’s not difficult. Double-click the chart to enter its editing mode. In the panel that opens at the top, click Data Ranges
image
In the second tab of the window that opens, change the order of the series to the opposite, not from 1 to 8, but from 8 to 1 - select the series one by one and move them to the desired location using the arrows.
image

1 Like

The sheet is protected with password.
The hard way: Send Backward as many times as you must click the up and down arrow buttons as described by @JohnSUN.
imagen

You should file a bug report, How to Report Bugs in LibreOffice - The Document Foundation Wiki, on one or both depending on how the graph is created in Excel:

  1. Layers appearing in reverse order
  2. Lack of transparency. My Excel 2010 doesn’t show transparency but your image does (Excel 365?) and Calc can make the graph areas partially transparent.