Hello there,
sorry for the question, but I feel like I have spent enough time already digging through forums and threads and still could not get it to work right.
My problem:
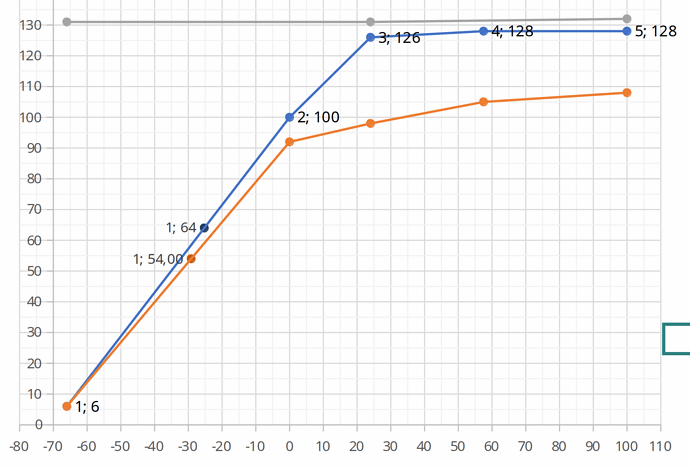
I have a single data point in a XY point-and-line graph. It has one float X and one float Y value from a table linked, aswell as a data row name. So basically it is a single point data row. I now want to show the coordinates in a label to be able to see the XY coordinates on a glance, because depending on other values, this datapoint might change a lot. The X and Y values in the linked cells come from formulas.
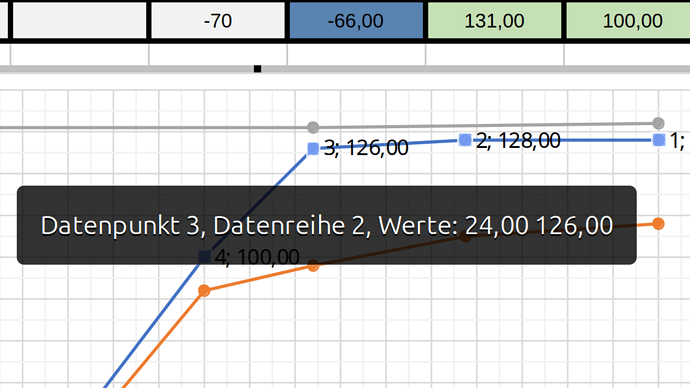
I have tried different approaches, but my coordinates are always “1;some number”. The problem is the 1. No matter how the numbers or the data is formatted, the X value is always 1, while in reality it should be something like “-24,65” or so (like the x value, which shows up corretly every time). I reckon it has something to do with the X value being treated as “category” in the data point formatting menu, but I am lost now.
Can someone please help me out? Thank you.
I added an image and realized, it does this with the other graphs, too. It really seems to have something to do with “categories”?
Version: 24.2.7.2 (X86_64) / LibreOffice Community
Build ID: 420(Build:2)
CPU threads: 12; OS: Linux 6.8; UI render: default; VCL: gtk3
Locale: de-DE (de_DE.UTF-8); UI: de-DE
Ubuntu package version: 4:24.2.7-0ubuntu0.24.04.1
Calc: threaded


