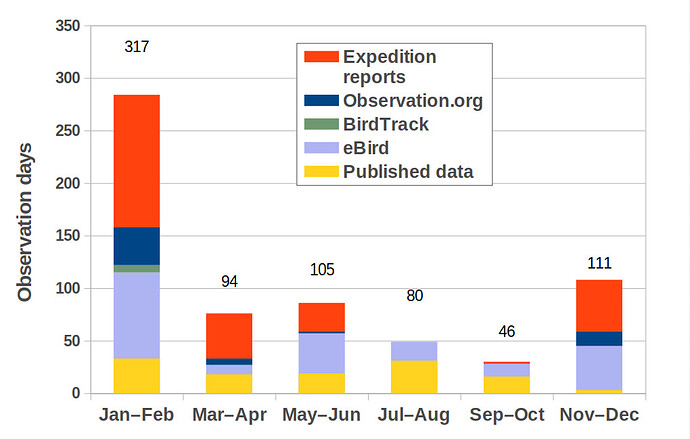
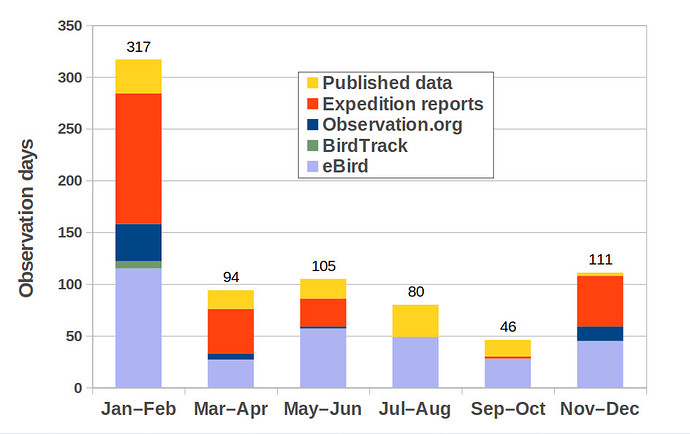
Hello I am using LibreOffice Version: 6.0.7.3 under Ubuntu 18.04. I had a good chart to which I added an additional series. It is bar with line in which the line is presented as numbers summing the series values. The original chart cannot be attached because I am a new user but the new chart (with the series BirdTrack added) is hopefully added as
.
The order of the series is as in the original chart, but in the new chart the legend places the series “Published data” at the bottom instead of the top, and the series sums are put above the bars at a distance apparently proportional to the value of “Published data” (instead of being just above the bars as in the original chart). I have checked all of the parameters and can’t see why this is happening, could you please help? Thanks so much, John
P.S. Not sure that I have uploaded the image correctly - if not I can put both on a server.


