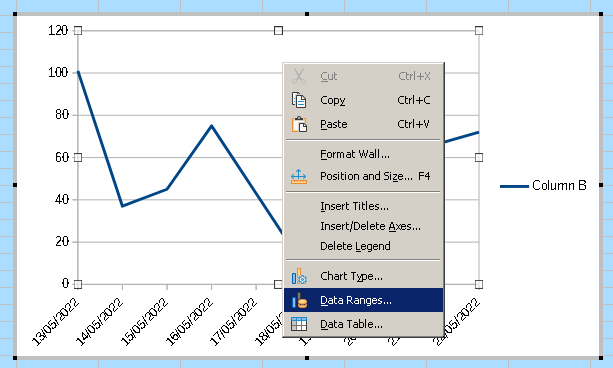
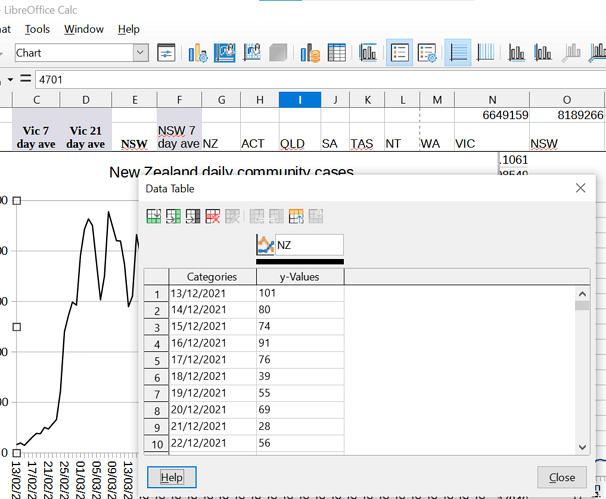
My spreadsheet contains a number of graphs which are designed to update when a new row is added to the bottom of the spreadsheet. The spreadsheet has added data tables (not me) and now my spreadsheet updates don’t update the data tables. If I select data ranges by editing the chart it says it will delete the data table but when I get into data ranges the data range is missing. I do not want to manually add data to the data table as the same data is used in multiple graphs, I want the spreadsheet to remove the data tables and continue to use the data ranges I have entered. Thanks in advance for your help
Calc has no data tables. You have to insert new rows manually.
Hi Velleroy, here is the link to help for Calc’s data table
https://help.libreoffice.org/7.3/en-GB/text/schart/01/03010000.html?System=WIN&DbPAR=CHART&HID=modules/schart/ui/chartdatadialog/dialog-action_area1#bm_@@nowidget@@
I have no idea how to handle these tables. They are some kind of fall-back when a chart has been copied around. I was expecting a regular Calc chart linked to a cell range.
Thanks Villeroy, I have no idea why the data tables are being generated. Hopefully someone will know how I get out of this hole
I created a chart in Writer. The first icon of the data table window inserts a new row below the current row. After copying the chart to Calc, I do not see any way to transfer the data into a cell range.
See related questions:
Also the description and comment 15 at the following bug report: tdf#142635. And comment 3 at tdf#140868.
Appears the only way to update the table is manually enter the data. If there was a refresh button it could at least reload the table in accordance with the range data
If do you have the original data ranges with values (as seen in your screenshot):
- Select the chart
-
Editthe chart - Choose
Data Ranges… - Accept to delete the internal data table
- Select the original data range and data series


Tested with LibreOffice 7.2.7.2 on Window 6.1.
Thanks LeroyG. That’s what I’ve done, unfortunately it deletes the data table it also deletes the data ranges I’ve put in and some of them are quite complex which requires a lot of work to rebuild. If there was a way I could view the data ranges I’ve put in then at least I could copy them and paste them back in when calc deletes them
Instead of X*N charts on X sheets, you should use one sheet with N charts supplied by X scenarios.
See https://user.services.openoffice.org/en/forum/download/file.php?id=3004
Browser isn’t allowing me to download that file

Macro to extract the data table to cell A1 of current sheet.
Adjust the two constants to choose another target cell.
Select the chart (single click) and run this code.
REM Select (single click) a chart on a sheet and run this routine
REM by default A1 is the top-left corner of the target range:
Const cStartCol = 0
Const cStartRow = 0

view = ThisComponent.getCurrentController()
sh = view.getActiveSheet()
obj = view.Selection.getByIndex(0)
'mri obj
oEmbeddedObject = obj.EmbeddedObject
oComponent = oEmbeddedObject.getComponent()
'mri oComponent
oData = oComponent.getData()
oRowDescriptions = oData.getRowDescriptions()
oColumnDescriptions = oData.getColumnDescriptions()
c = uBound(oColumnDescriptions)
r = uBound(oRowDescriptions)
redim a(r)
for i = 0 to r
	a(i) = Array(oRowDescriptions(i))
next
sh.getCellRangeByPosition(cStartCol +1, cStartRow, cStartCol + c +1, cStartRow).setDataArray(Array(oColumnDescriptions))
sh.getCellRangeByPosition(cStartCol, cStartRow +1, cStartCol, cStartRow + r +1).setDataArray(a)
sh.getCellRangeByPosition(cStartCol +1, cStartRow +1, cStartCol + c +1, cStartRow + r +1).setDataArray(oData.getData())
End Sub
Now you can double-click the chart, right-click>Data Ranges … and select the generated cell range as chart source.
Thanks Villeroy, is this macro extracting the data range text or the data table data? What I need is the text of the data range
Should I open a bug report? If so how do I do that?
Plotted data need to be numbers. The macro transfers labels as text and plotted data as numbers.
The issue with copied charts is well known.
IMHO, the best solution (more than a work-around) is a single chart with scenarios.

