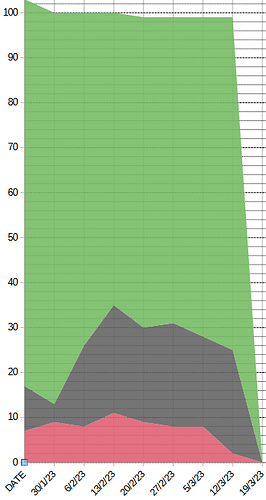
Chart with initial and future values plunging to zero

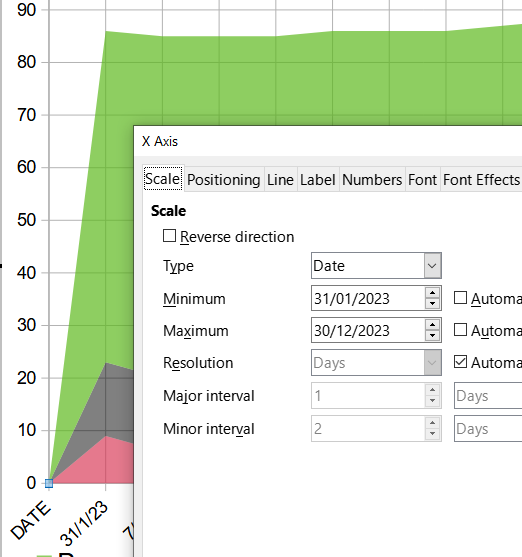
Here is the chart with the problem values displayed.

The chart is redundantly representing data from before the first date that had data. It’s also representing as zero, future dates for which there isn’t any data yet.

The data is entered week by week, but all future values aren’t displayed in the spreadsheet. One of the formulae for this arrangement is

=IF(V$5<=TODAY(),COUNTIFS(V6:V128,"<>N/A*",V6:V128,"<>"),"")

Can someone explain how to shift the first date to the left so that its corresponding value appears at the y-axis, and how to get the last date, which is in the future and for which there isn’t yet any data, not to show that plunge to zero?

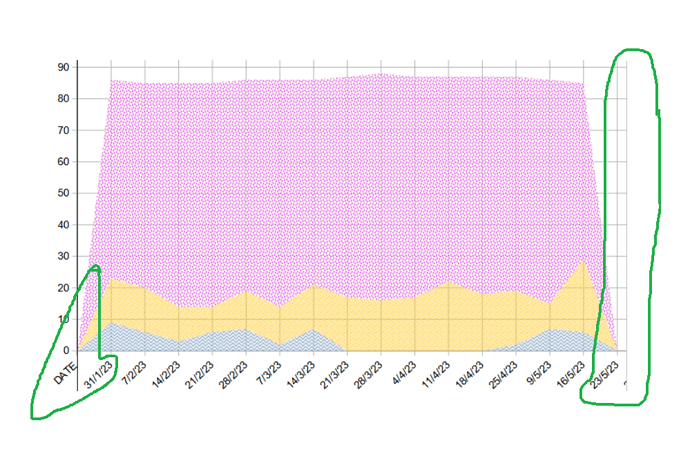
Take a look at this file…

https://ask.libreoffice.org/uploads/short-url/QhRMlfJMnlBJVYgiPZQhOqiQwl.ods

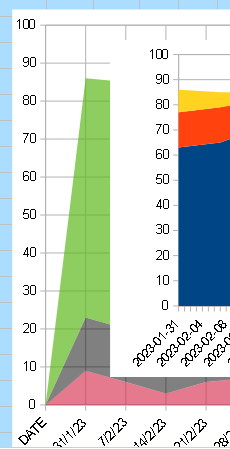
Thank you. Is this what you mean?


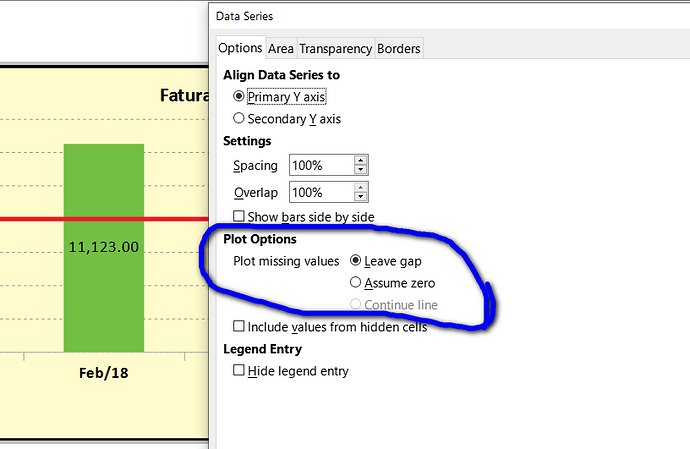
That option doesn’t exist on my spreadsheet.

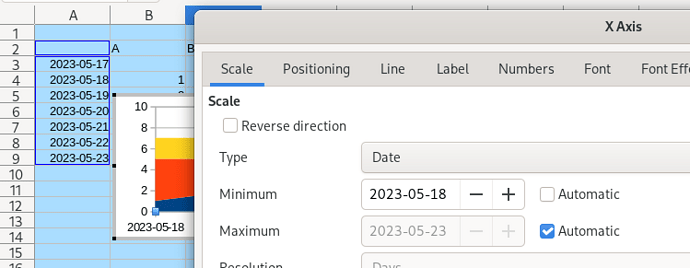
  • Edit the chart
  • Format X Axis as Date
  • Set the appropriate Minimum and Maximum dates (unmark Automatic)

Many thanks Leroy. I’ll try that.

…but unfortunately I wasn’t able to get that to work. Might have done it wrongly.

GRAPH TEST.xlsx (50.6 KB)

Please, edit your question, and add a sample file there to test. Thanks.

I’ve done that. There’s a link in the above reply, since I wasn’t able to edit the original post.

Here, again:

https://ask.libreoffice.org/uploads/short-url/9M4hGzA64e7d96MkiBZEYTZxM3a.xlsx

Maybe the chart suffered a corruption during conversion (from xlsx).
Create it again.
imagen
Ever when possible, save as .ods.

2 Likes

That’s worked. Recreated the chart, and all the parameters could magically be set as expected. Thanks, LeroyG.

1 Like

Hi again. Though I’ve got the areas displaying as desired at the start of the dates on the X axis, the values for the most recent date are still plunging down to zero.

I’ve tried everything I can think of from trying to shift the X axis labels to the left, to changing the maximum date.

Save as .ods, and share the file to test.